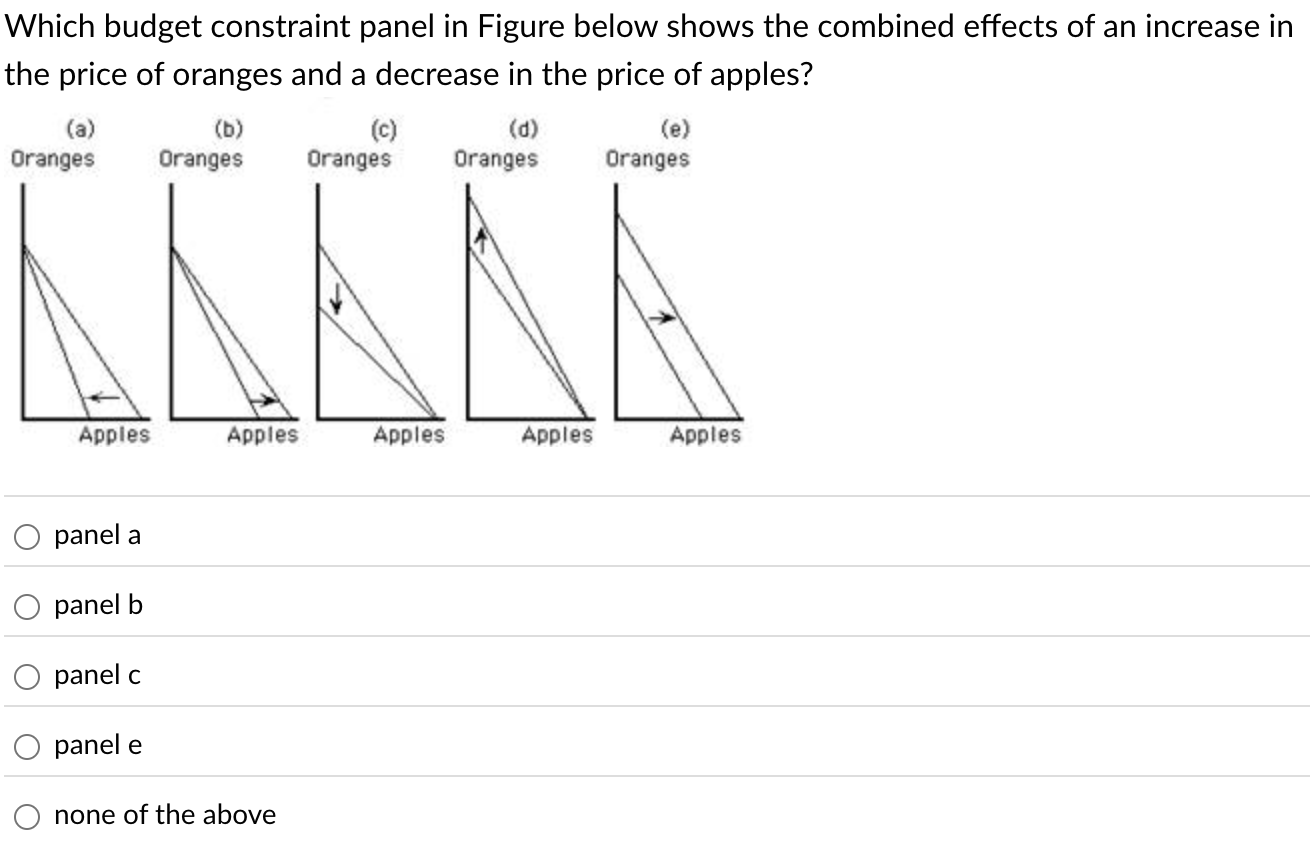
Which budget constraint panel in Figure below shows the combined effects of an increase in the price of oranges and a decrease in the price of apples?

Understand the Problem
The question is asking which panel accurately represents the budget constraint changes resulting from an increase in the price of oranges and a decrease in the price of apples. This involves understanding how budget constraints shift and what that means graphically.
Answer
Panel c
The final answer is panel c.
Answer for screen readers
The final answer is panel c.
More Information
Panel c reflects both an increase in the price of oranges (shifting the line inward on the vertical axis) and a decrease in the price of apples (shifting the line outward on the horizontal axis), showing the combined effect.
Tips
A common mistake is misinterpreting the axes directions or not considering both changes simultaneously.
Sources
AI-generated content may contain errors. Please verify critical information