What is the opportunity cost if I increase production of cellphones from 7 to 9 (from point C to B)?
Understand the Problem
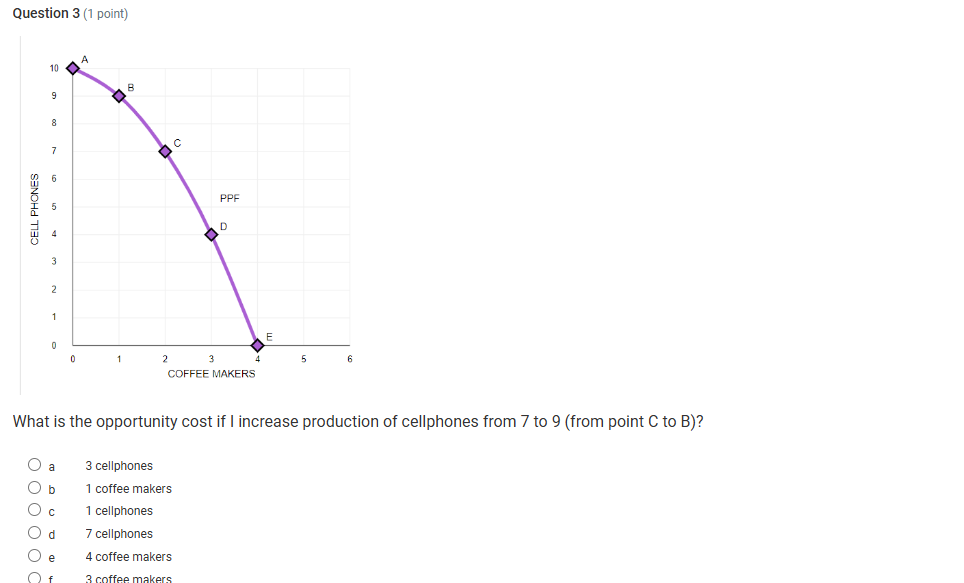
The question is asking for the opportunity cost associated with increasing the production of cellphones from 7 to 9 while using a production possibilities frontier (PPF) graph that shows the trade-off with coffee makers. We need to analyze the graph to determine how many coffee makers (or other resources) need to be sacrificed for this increase in cellphone production.
Answer
1 coffee maker
Answer for screen readers
1 coffee maker
Steps to Solve
- Identify the points on the PPF graph
From the graph, locate the points C and B. According to the graph:
- Point C corresponds to the production of 7 cellphones.
- Point B corresponds to the production of 9 cellphones.
- Determine the opportunity cost involved
To find the opportunity cost, identify how many coffee makers are sacrificed when moving from Point C to Point B. From the graph:
- Point C shows production of coffee makers at approximately 2 units.
- Point B shows production of coffee makers at approximately 1 unit.
- Calculate the sacrifice in coffee makers
The difference in coffee makers going from Point C to B is: $$ \text{Coffee makers sacrificed} = \text{Coffee makers at C} - \text{Coffee makers at B} = 2 - 1 = 1 $$
- Summarize the opportunity cost
The opportunity cost for increasing the production of cellphones from 7 to 9 (going from C to B) is therefore 1 coffee maker.
1 coffee maker
More Information
The concept of opportunity cost illustrates the trade-off in production choices. To produce more of one good (cellphones), resources must be diverted from another good (coffee makers), highlighting the economic principle of scarcity.
Tips
- Misreading the graph and identifying incorrect coordinates for points C and B.
- Forgetting to subtract the initial value from the final value to find the opportunity cost.
AI-generated content may contain errors. Please verify critical information