What does the map show about sediment thickness in the world's oceans and marginal seas?
Understand the Problem
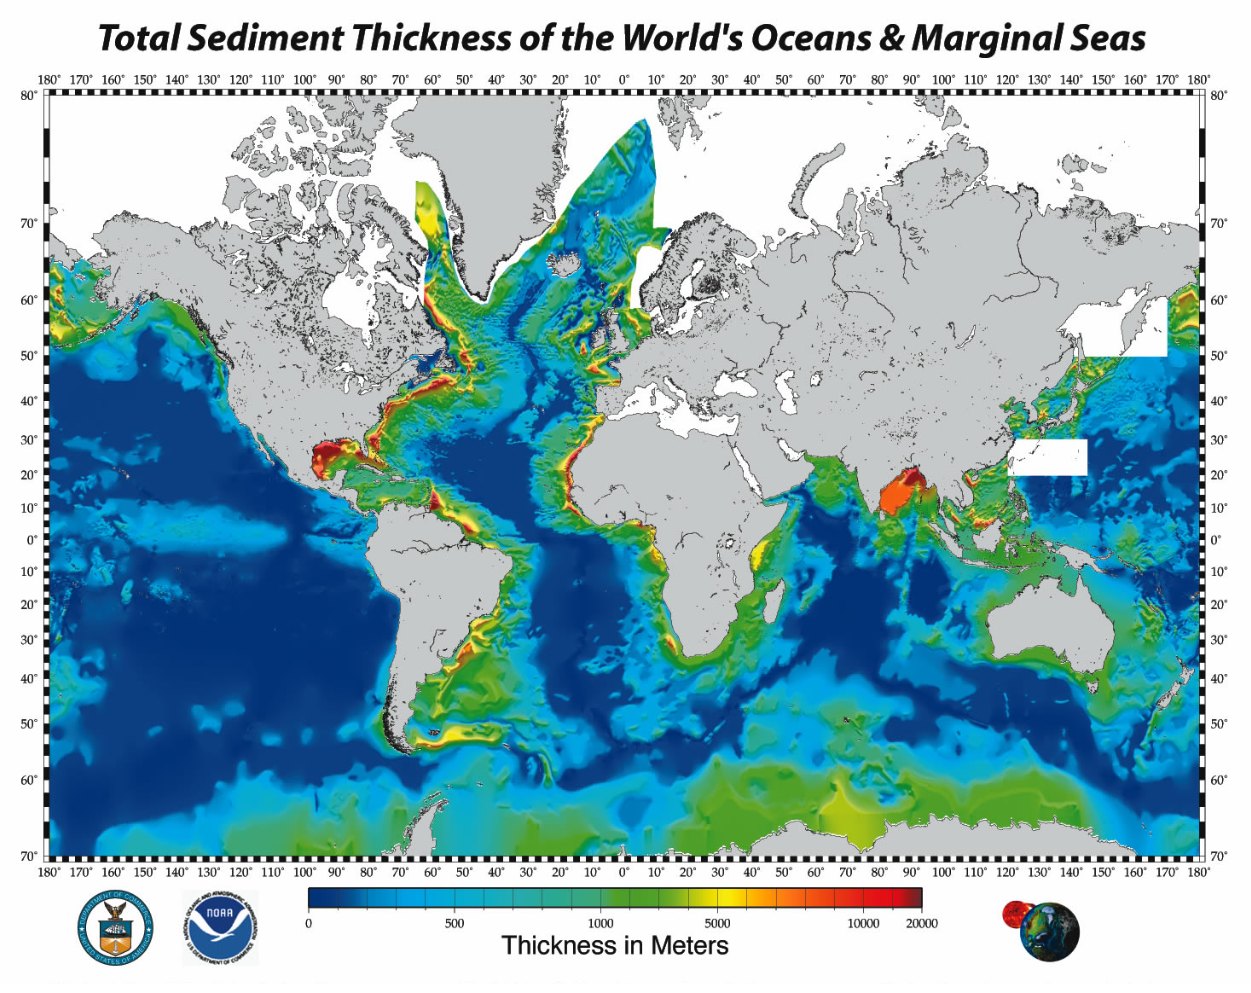
The question is asking us to interpret a map showing total sediment thickness across the world's oceans and seas. The map visually represents varying sediment thickness in meters using a color gradient, indicating regions of different sediment accumulation.
Answer
The map displays global sediment thickness variations, from thin at ocean ridges to thick near continents.
The map shows variations in sediment thickness across different regions of the world's oceans and marginal seas, from thin sediments in mid-ocean ridges to thick accumulations around continental margins and specific areas like the Bay of Bengal.
Answer for screen readers
The map shows variations in sediment thickness across different regions of the world's oceans and marginal seas, from thin sediments in mid-ocean ridges to thick accumulations around continental margins and specific areas like the Bay of Bengal.
More Information
Sediment thickness varies widely due to tectonic activity, sediment supply, and ocean currents. Areas like the Bay of Bengal have significant accumulations due to riverine input.
Tips
A common mistake is interpreting the colors inaccurately; always refer to the legend for thickness values.
Sources
- Total Sediment Thickness of the World's Oceans and Marginal Seas - ngdc.noaa.gov
- GlobSed: Updated Total Sediment Thickness - agupubs.onlinelibrary.wiley.com
AI-generated content may contain errors. Please verify critical information