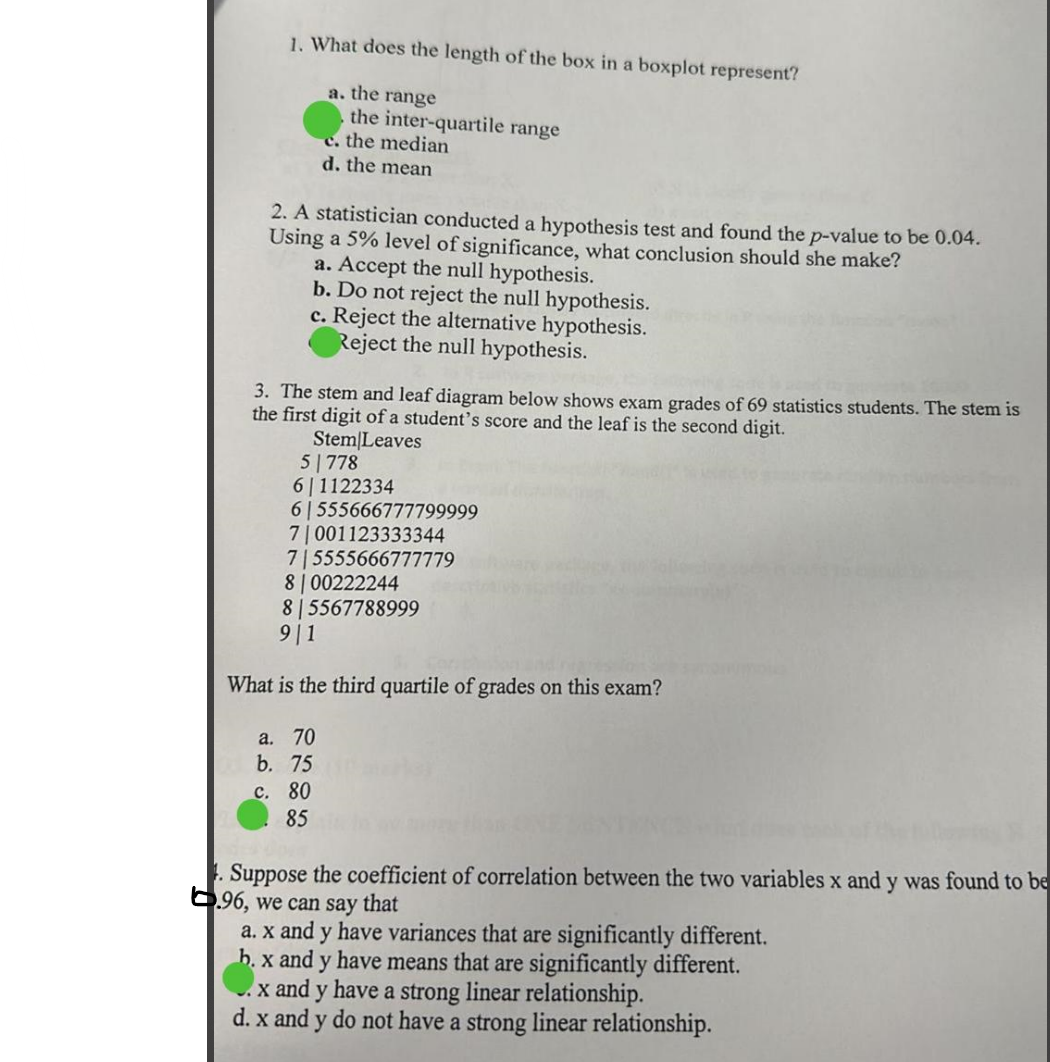
What does the length of the box in a boxplot represent? A statistician conducted a hypothesis test and found the p-value to be 0.04. Using a 5% level of significance, what conclusi... What does the length of the box in a boxplot represent? A statistician conducted a hypothesis test and found the p-value to be 0.04. Using a 5% level of significance, what conclusion should she make? What is the third quartile of grades on this exam? Suppose the coefficient of correlation between the two variables x and y was found to be 0.96, we can say that...

Understand the Problem
The question asks about the interpretation of different statistical concepts including boxplots, hypothesis tests, quartiles, and correlation. It focuses on identifying specific statistical principles and how they are applied in analyzing data.
Answer
1. Interquartile range; 2. Reject null hypothesis; 3. 85; 4. Strong linear relationship.
The answers are: 1. Interquartile range; 2. Reject the null hypothesis; 3. 85; 4. x and y have a strong linear relationship.
Answer for screen readers
The answers are: 1. Interquartile range; 2. Reject the null hypothesis; 3. 85; 4. x and y have a strong linear relationship.
More Information
The length of the box in a boxplot is crucial as it shows the spread of the middle 50% of data, effectively highlighting variability and potential outliers.
Tips
Common mistakes include confusing the interquartile range with overall range or misinterpreting the significance of the p-value.
Sources
- Box Plots | Introduction to Statistics - Lumen Learning - courses.lumenlearning.com
- Box plots & t-tests - tiee.esa.org
AI-generated content may contain errors. Please verify critical information