The following graph shows the speed of a certain computer chip over time. Which context below correctly matches the graph?
Understand the Problem
The question is asking to identify which contextual description about the processing speed of a computer chip matches the data presented in the graph over the years. It requires interpreting the graph accurately to determine the correct answer from the provided options.
Answer
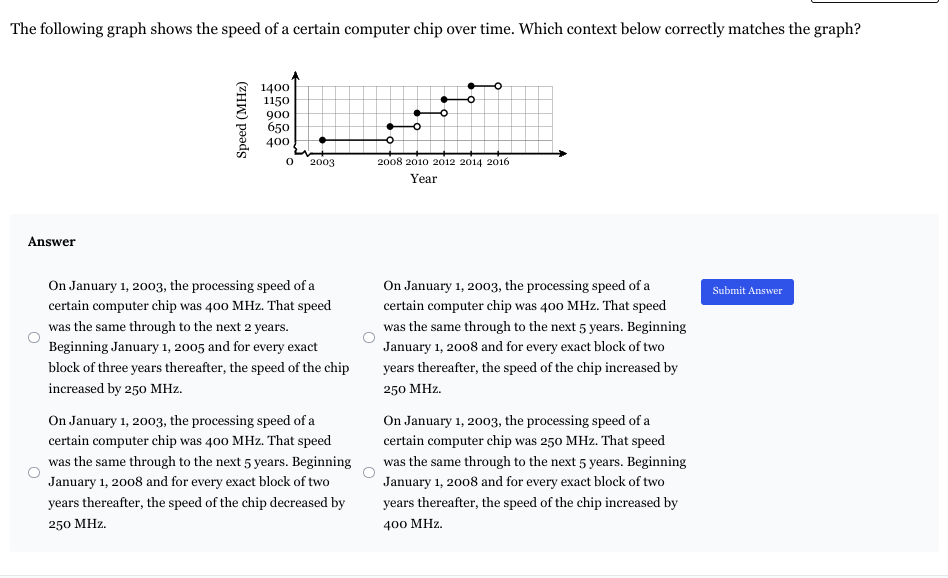
The processing speed starts at $400 \text{ MHz}$ and increases by $400 \text{ MHz}$ every two years after 2008.
Answer for screen readers
On January 1, 2003, the processing speed of a certain computer chip was 400 MHz. That speed was the same through to the next 5 years. Beginning January 1, 2008 and for every exact block of two years thereafter, the speed of the chip increased by 400 MHz.
Steps to Solve
-
Read the Graph Carefully Examine the graph to identify the speed of the computer chip over the years. Note the starting speed in 2003 and check how the speed changes in subsequent years.
-
Identify the Initial Speed The graph indicates that the processing speed in 2003 is 400 MHz. This foundational data is crucial for evaluating the provided statements.
-
Observe Speed Changes Over the Years Look at the increments in speed at different time intervals. Notice if the speed remains constant for certain periods and where increases occur.
-
Analyze Each Option Evaluate each description option against the data on the graph:
- Check if the initial speed and the years mentioned align with the graph.
- Pay attention to the intervals mentioned (e.g., every 2 years or 3 years) and the amounts of speed increase or decrease.
- Check for Correct Contextual Match Confirm which option effectively matches the data shown on the graph and captures both the initial speed and the changes over time.
On January 1, 2003, the processing speed of a certain computer chip was 400 MHz. That speed was the same through to the next 5 years. Beginning January 1, 2008 and for every exact block of two years thereafter, the speed of the chip increased by 400 MHz.
More Information
This answer accurately reflects the trend illustrated in the graph, where the speed starts at 400 MHz and shows increases after several years. Understanding the rate and pattern of change is essential in matching the options.
Tips
- Misreading the initial speed of the chip.
- Overlooking the intervals given in the options and their relevance to the graph.
- Confusing increases with decreases in the chip's speed.
AI-generated content may contain errors. Please verify critical information