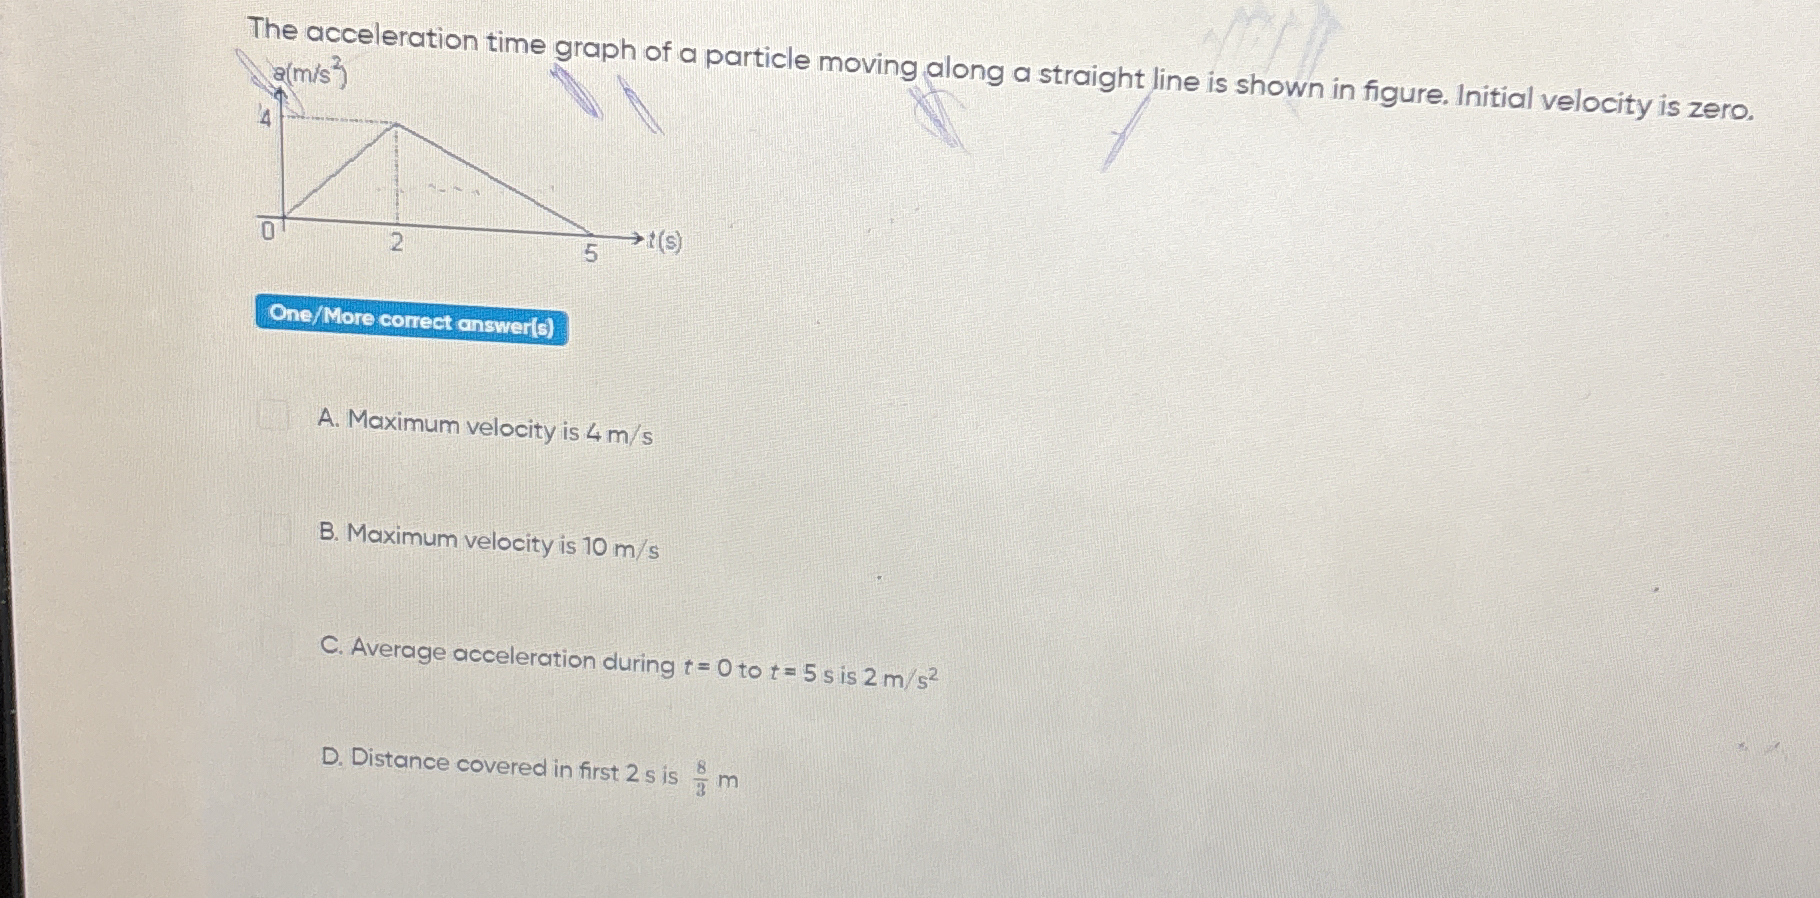
The acceleration time graph of a particle moving along a straight line is shown in the figure. Initial velocity is zero. What is (A) maximum velocity, (B) average acceleration duri... The acceleration time graph of a particle moving along a straight line is shown in the figure. Initial velocity is zero. What is (A) maximum velocity, (B) average acceleration during t = 0 to t = 5, (C) distance covered in the first 2 seconds?

Understand the Problem
The question is asking about the acceleration-time graph of a particle and requires determining various kinematic aspects such as maximum velocity, average acceleration, and distance covered within specific time intervals based on the provided graph.
Answer
Maximum velocity is $4 \, \text{m/s}$.
Answer for screen readers
The correct answers are:
- A. Maximum velocity is $4 , \text{m/s}$
- C. Average acceleration during $t = 0$ to $t = 5$ s is $0.8 , \text{m/s}^2$
- Distance covered in first $2.5$ s is not $8/3$ m, but needs to be recalculated.
Steps to Solve
- Identify the areas under the graph for velocity calculation
The area under the acceleration-time graph gives the change in velocity. The graph consists of a triangle and a rectangle.
- Calculate the area of the triangle
The triangle is formed from $t = 0$ to $t = 2$ seconds with a height of $4 , \text{m/s}^2$ and a base of $2 , \text{s}$.
The area (which represents the change in velocity) is calculated as:
$$ \text{Area}_{\text{triangle}} = \frac{1}{2} \times \text{base} \times \text{height} = \frac{1}{2} \times 2 , \text{s} \times 4 , \text{m/s}^2 = 4 , \text{m/s} $$
- Calculate the area of the rectangle
The rectangle extends from $t = 2$ to $t = 5$ seconds with a height of $0 , \text{m/s}^2$ and a width of $3 , \text{s}$.
The area is calculated as:
$$ \text{Area}_{\text{rectangle}} = \text{base} \times \text{height} = 3 , \text{s} \times 0 , \text{m/s}^2 = 0 , \text{m/s} $$
- Total change in velocity
Sum the areas calculated:
$$ \text{Total change in velocity} = \text{Area}{\text{triangle}} + \text{Area}{\text{rectangle}} = 4 , \text{m/s} + 0 , \text{m/s} = 4 , \text{m/s} $$
- Average acceleration calculation
The average acceleration over the interval from $t=0$ to $t=5$ seconds is calculated using the formula:
$$ \text{Average acceleration} = \frac{\text{Total change in velocity}}{\text{Total time}} = \frac{4 , \text{m/s}}{5 , \text{s}} = 0.8 , \text{m/s}^2 $$
- Distance calculation
The distance can be found to be the area under the velocity-time curve. Since we now know that the final velocity is $4 , \text{m/s}$ at $t = 5 \text{s}$, the average velocity in that time is:
$$ \text{Average Velocity} = \frac{0 + 4}{2} = 2 , \text{m/s} $$
Therefore, the distance traveled is:
$$ \text{Distance} = \text{Average Velocity} \times \text{Total Time} = 2 , \text{m/s} \times 5 , \text{s} = 10 , \text{m} $$
The correct answers are:
- A. Maximum velocity is $4 , \text{m/s}$
- C. Average acceleration during $t = 0$ to $t = 5$ s is $0.8 , \text{m/s}^2$
- Distance covered in first $2.5$ s is not $8/3$ m, but needs to be recalculated.
More Information
The results show that the maximum velocity reached by the particle is directly determined by the area under the acceleration-time graph, confirming basic principles of kinematics.
Tips
- Miscalculating the areas under the graph, especially if not treating the triangle and rectangle separately.
- Confusing acceleration with velocity and calculating the wrong values for average acceleration and distance.
AI-generated content may contain errors. Please verify critical information