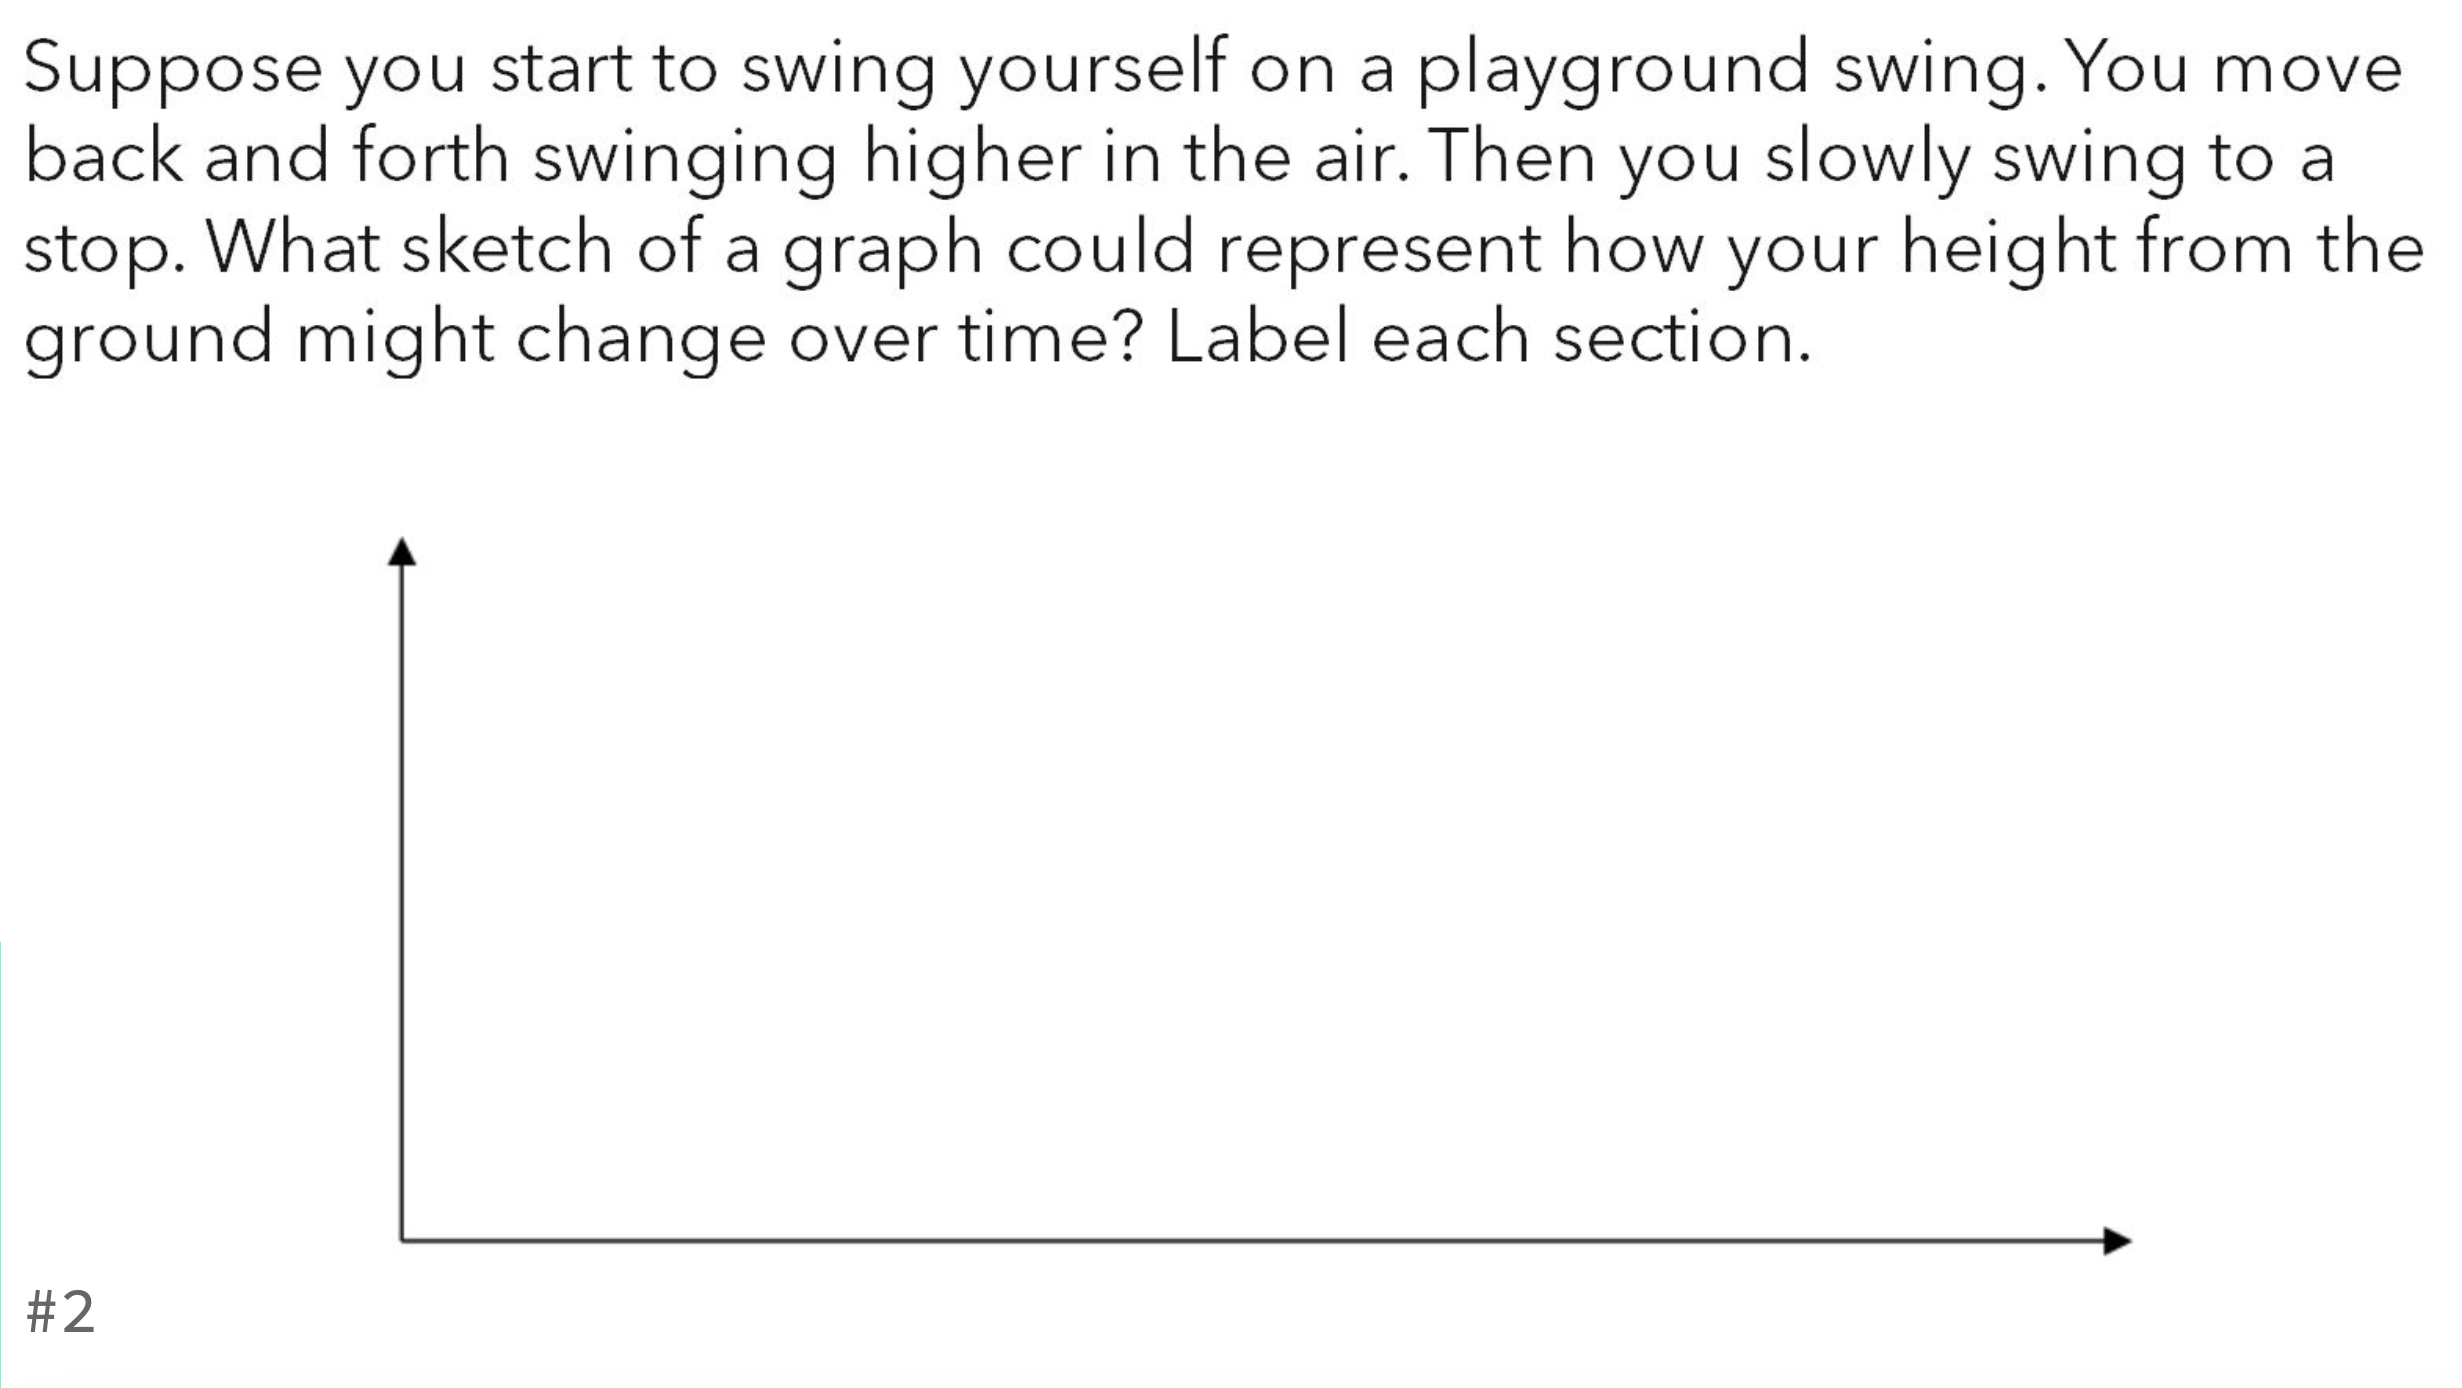
Suppose you start to swing yourself on a playground swing. You move back and forth swinging higher in the air. Then you slowly swing to a stop. What sketch of a graph could represe... Suppose you start to swing yourself on a playground swing. You move back and forth swinging higher in the air. Then you slowly swing to a stop. What sketch of a graph could represent how your height from the ground might change over time? Label each section.
Understand the Problem
The question is asking for a sketch of a graph that represents the change in height from the ground while swinging. It involves understanding motion over time, particularly how height changes as one swings back and forth, then slows down to stop.
Answer
The graph has a wave-like pattern that reflects increasing and decreasing heights, eventually stabilizing at a constant level when stopped.
Answer for screen readers
The sketch of the graph showing how your height from the ground changes over time will feature curves that rise and fall, creating a wave-like pattern, eventually leveling off as you come to a stop.
The graph sections can be labeled as:
- Rising height (initial swing up)
- Maximum height (peak)
- Falling height (swing down)
- Rising again (swing forward)
- Slowing down (decreasing arcs)
- Final stop (horizontal line)
Steps to Solve
-
Initial Height Increase At the start, as you swing up, your height from the ground will increase. This will be represented by a rising curve on the graph.
-
Maximum Height When you reach the highest point of your swing, your height will be at its peak. This point appears as a flat peak on the graph before you start descending.
-
Descent Phase As you swing back down, your height decreases. This part of the graph will show a downward curve, reflecting your descent.
-
Swinging Forward After reaching the lowest point, you go back up again. The graph will begin to rise again, creating a similar pattern to the earlier heights.
-
Slowing Down Eventually, as you slow down, the swings will become less energetic. Each rise will be lower than the previous ones, leading to a gradual horizontal approach as you come to a stop.
-
Final Stop When you finally come to a halt, your height from the ground will stabilize at a constant value, represented by a horizontal line on the graph.
The sketch of the graph showing how your height from the ground changes over time will feature curves that rise and fall, creating a wave-like pattern, eventually leveling off as you come to a stop.
The graph sections can be labeled as:
- Rising height (initial swing up)
- Maximum height (peak)
- Falling height (swing down)
- Rising again (swing forward)
- Slowing down (decreasing arcs)
- Final stop (horizontal line)
More Information
This graph reflects the cyclical motion of swinging. The key points include the initial swings gaining height, reaching the peak, and the energy waning until you come to a standstill.
Tips
- Forgetting to show the gradual decrease in height as you slow down.
- Not labeling the sections clearly, which may confuse the different phases of the swing.
- Skipping the peaks or valleys in the graph should reflect maximum and minimum heights.
AI-generated content may contain errors. Please verify critical information