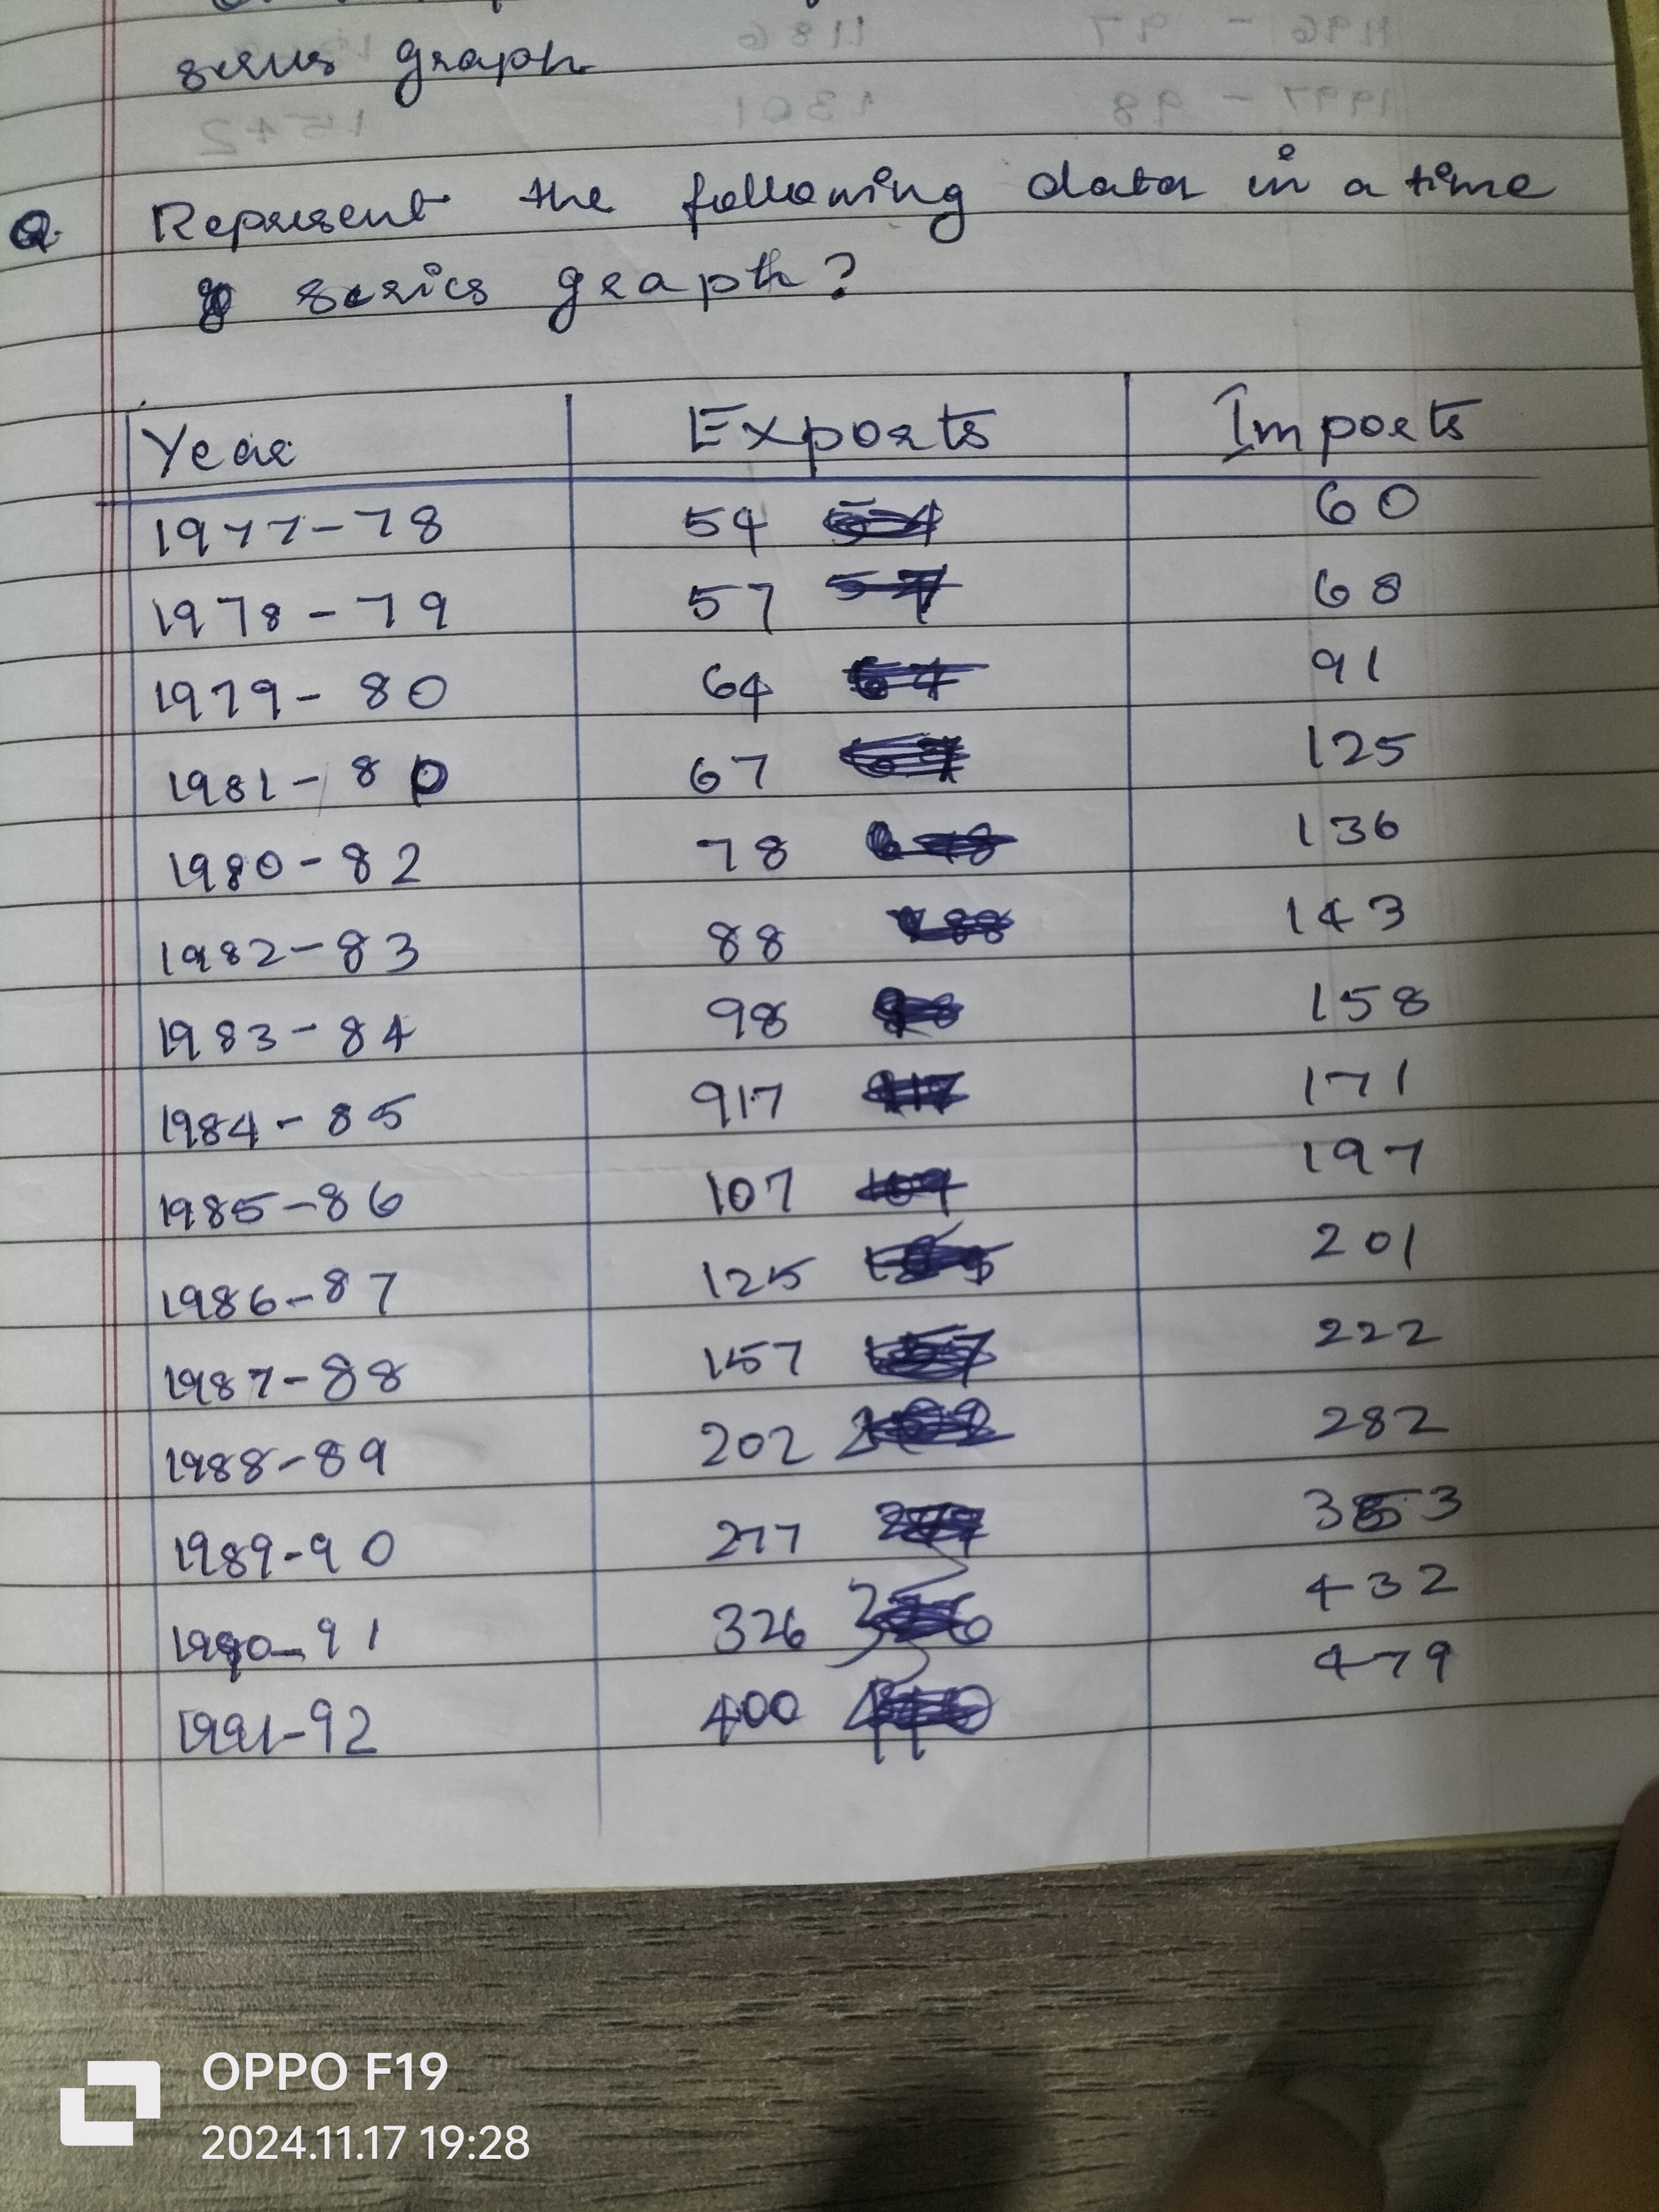
Represent the following data in a time series graph?

Understand the Problem
The question is asking to represent the given data of exports and imports over the years in a time series graph. This involves plotting the values of exports and imports against the corresponding years to visualize trends over time.
Answer
Plot a line graph with years on x-axis, Exports and Imports on y-axis.
Plot the years on the x-axis, Exports and Imports on the y-axis. Connect data points to form two lines representing each category.
Answer for screen readers
Plot the years on the x-axis, Exports and Imports on the y-axis. Connect data points to form two lines representing each category.
More Information
Time series graphs help visualize trends over time, making it easier to analyze changes in exports and imports year-on-year.
Tips
Common mistakes include mislabeling axes or not using a consistent scale. Ensure accurate data points for clarity.
Sources
- Time Series Graph - Math Steps, Examples & Questions - thirdspacelearning.com
- An Explainer on Time-Series Graphs With Examples - Timescale - timescale.com
AI-generated content may contain errors. Please verify critical information