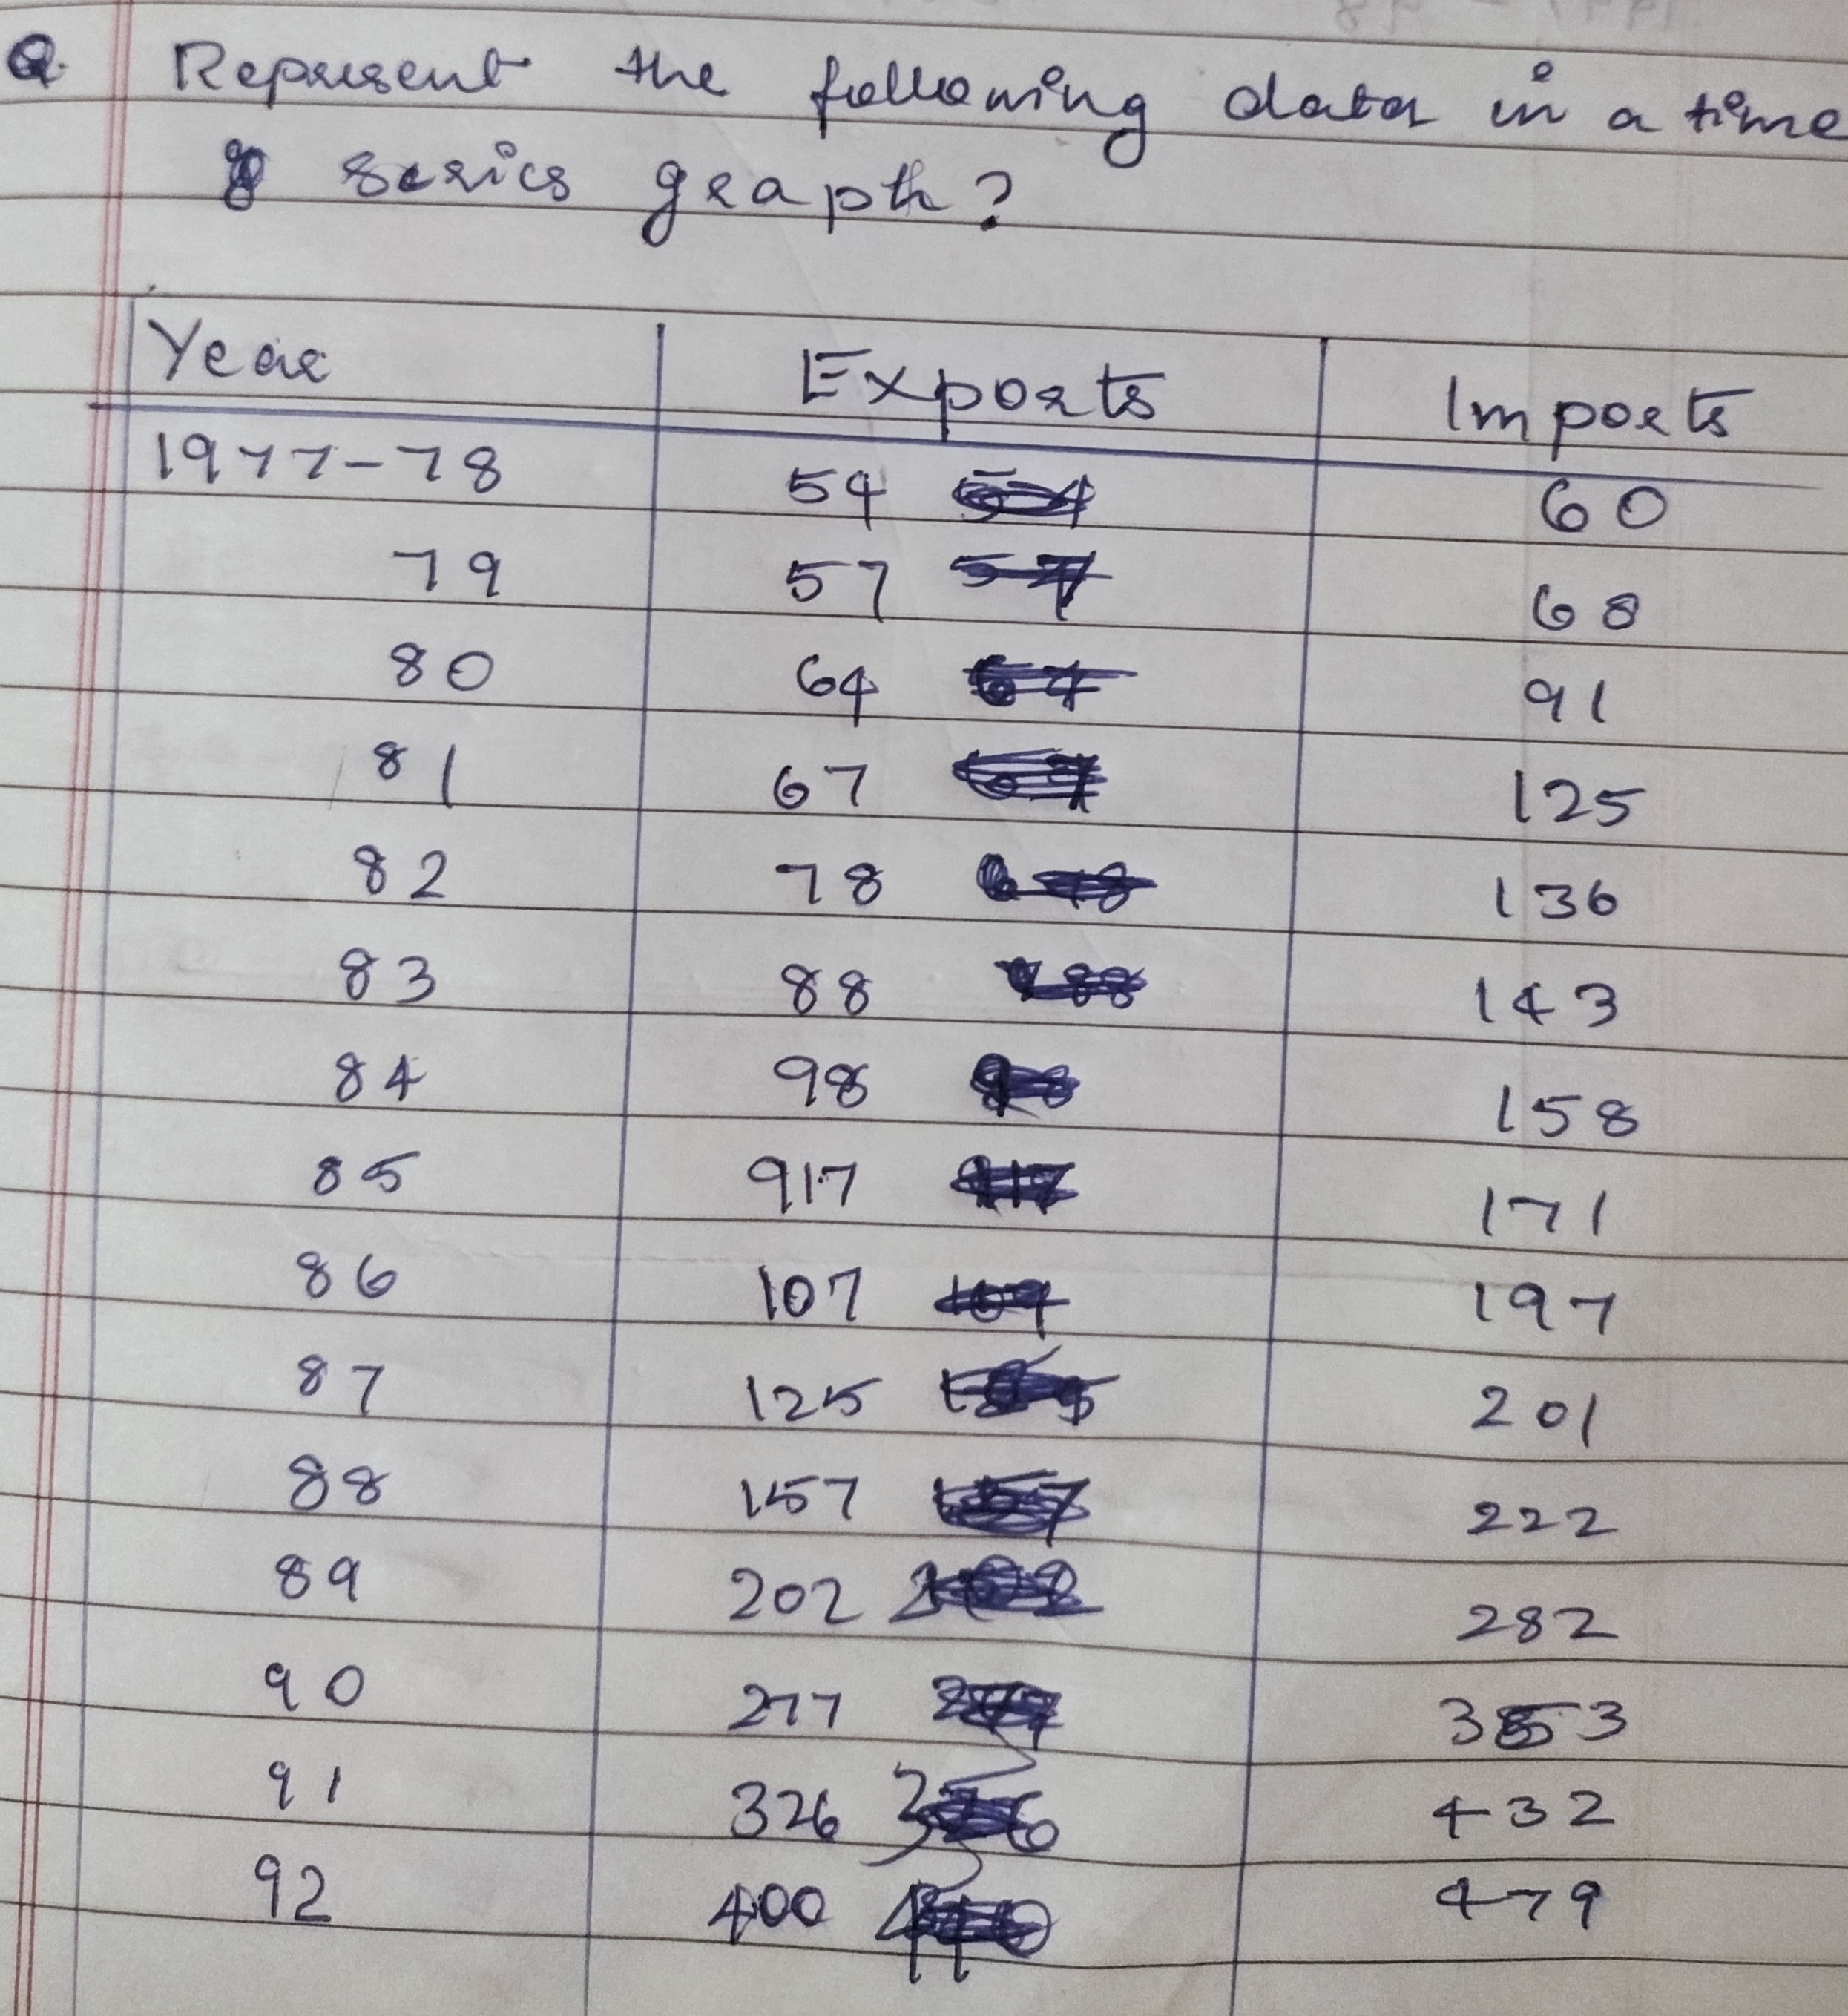
Represent the following data in a time series graph?

Understand the Problem
The question is asking to represent the provided data, which includes years along with corresponding export and import figures, in the form of a time series graph.
Answer
Plot lines for exports and imports from 1977 to 1992 to visualize trends.
Plot export and import values against time, connecting data points with lines for a clear view of trends.
Answer for screen readers
Plot export and import values against time, connecting data points with lines for a clear view of trends.
More Information
Time series graphs are effective for showing trends and patterns over intervals. This dataset reveals increasing export and import trends over the years.
Tips
Common mistakes include not labeling axes correctly or failing to use different styles for multiple data sets.
Sources
- Time Series Graph - Math Steps, Examples & Questions - thirdspacelearning.com
- An Explainer on Time-Series Graphs With Examples - Timescale - timescale.com
- Time Series in Statistics | Graph, Plot & Examples - Lesson | Study.com - study.com
AI-generated content may contain errors. Please verify critical information