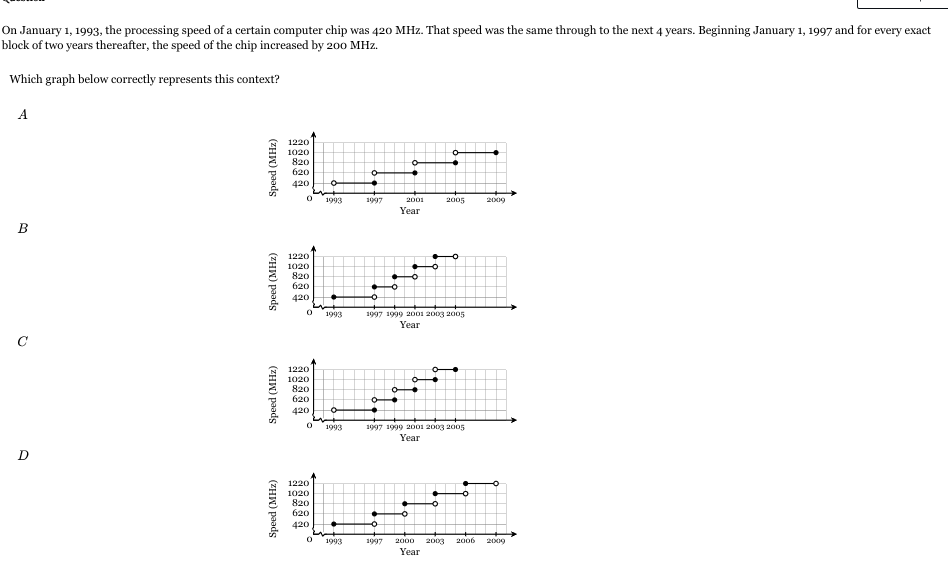
On January 1, 1993, the processing speed of a certain computer chip was 420 MHz. That speed was the same through to the next 4 years. Beginning January 1, 1997 and for every exact... On January 1, 1993, the processing speed of a certain computer chip was 420 MHz. That speed was the same through to the next 4 years. Beginning January 1, 1997 and for every exact block of two years thereafter, the speed of the chip increased by 200 MHz. Which graph below correctly represents this context?
Understand the Problem
The question is asking which graph correctly represents the increase in processing speed of a computer chip over time, given that the speed is constant for the first four years and increases by 200 MHz every two years thereafter.
Answer
The correct graph is **B**.
Answer for screen readers
The correct graph that represents the context is B.
Steps to Solve
-
Identify Initial Speed
The processing speed of the computer chip starts at 420 MHz on January 1, 1993. -
Determine Years of Constant Speed
The speed remains constant for the first four years, which means it stays at 420 MHz from 1993 until 1997. -
Calculate Speed Increases
Starting from January 1, 1997, the speed increases by 200 MHz for every two-year block:- By 1997, the speed is still 420 MHz.
- By the end of 1998, the speed increases to 620 MHz.
- By the end of 2000, the speed increases to 820 MHz.
- By the end of 2002, the speed increases to 1020 MHz.
- By the end of 2004, the speed increases to 1220 MHz.
-
Construct a Timeline
Now we have the speed at each significant year:- 1993: 420 MHz
- 1997: 420 MHz
- 1999: 620 MHz
- 2001: 820 MHz
- 2003: 1020 MHz
- 2005: 1220 MHz
- 2009: 1220 MHz
-
Analyze the Graph Options
Compare each graph option (A, B, C, D) to find the one that accurately represents these points and the constant speed in the first four years followed by the increases at the specified years.
The correct graph that represents the context is B.
More Information
The processing speed starts at 420 MHz, remains constant until 1997, and increases every two years thereafter. This results in specific designated speed increments which must be correctly depicted in the graph's stepwise increase.
Tips
- Misinterpreting Constant Speed: A common mistake is thinking the speed changes before it should; the speed should remain constant until 1997.
- Incorrectly Placing Increments: Some could overlook the timing of the increments and place them incorrectly on the graph.
AI-generated content may contain errors. Please verify critical information