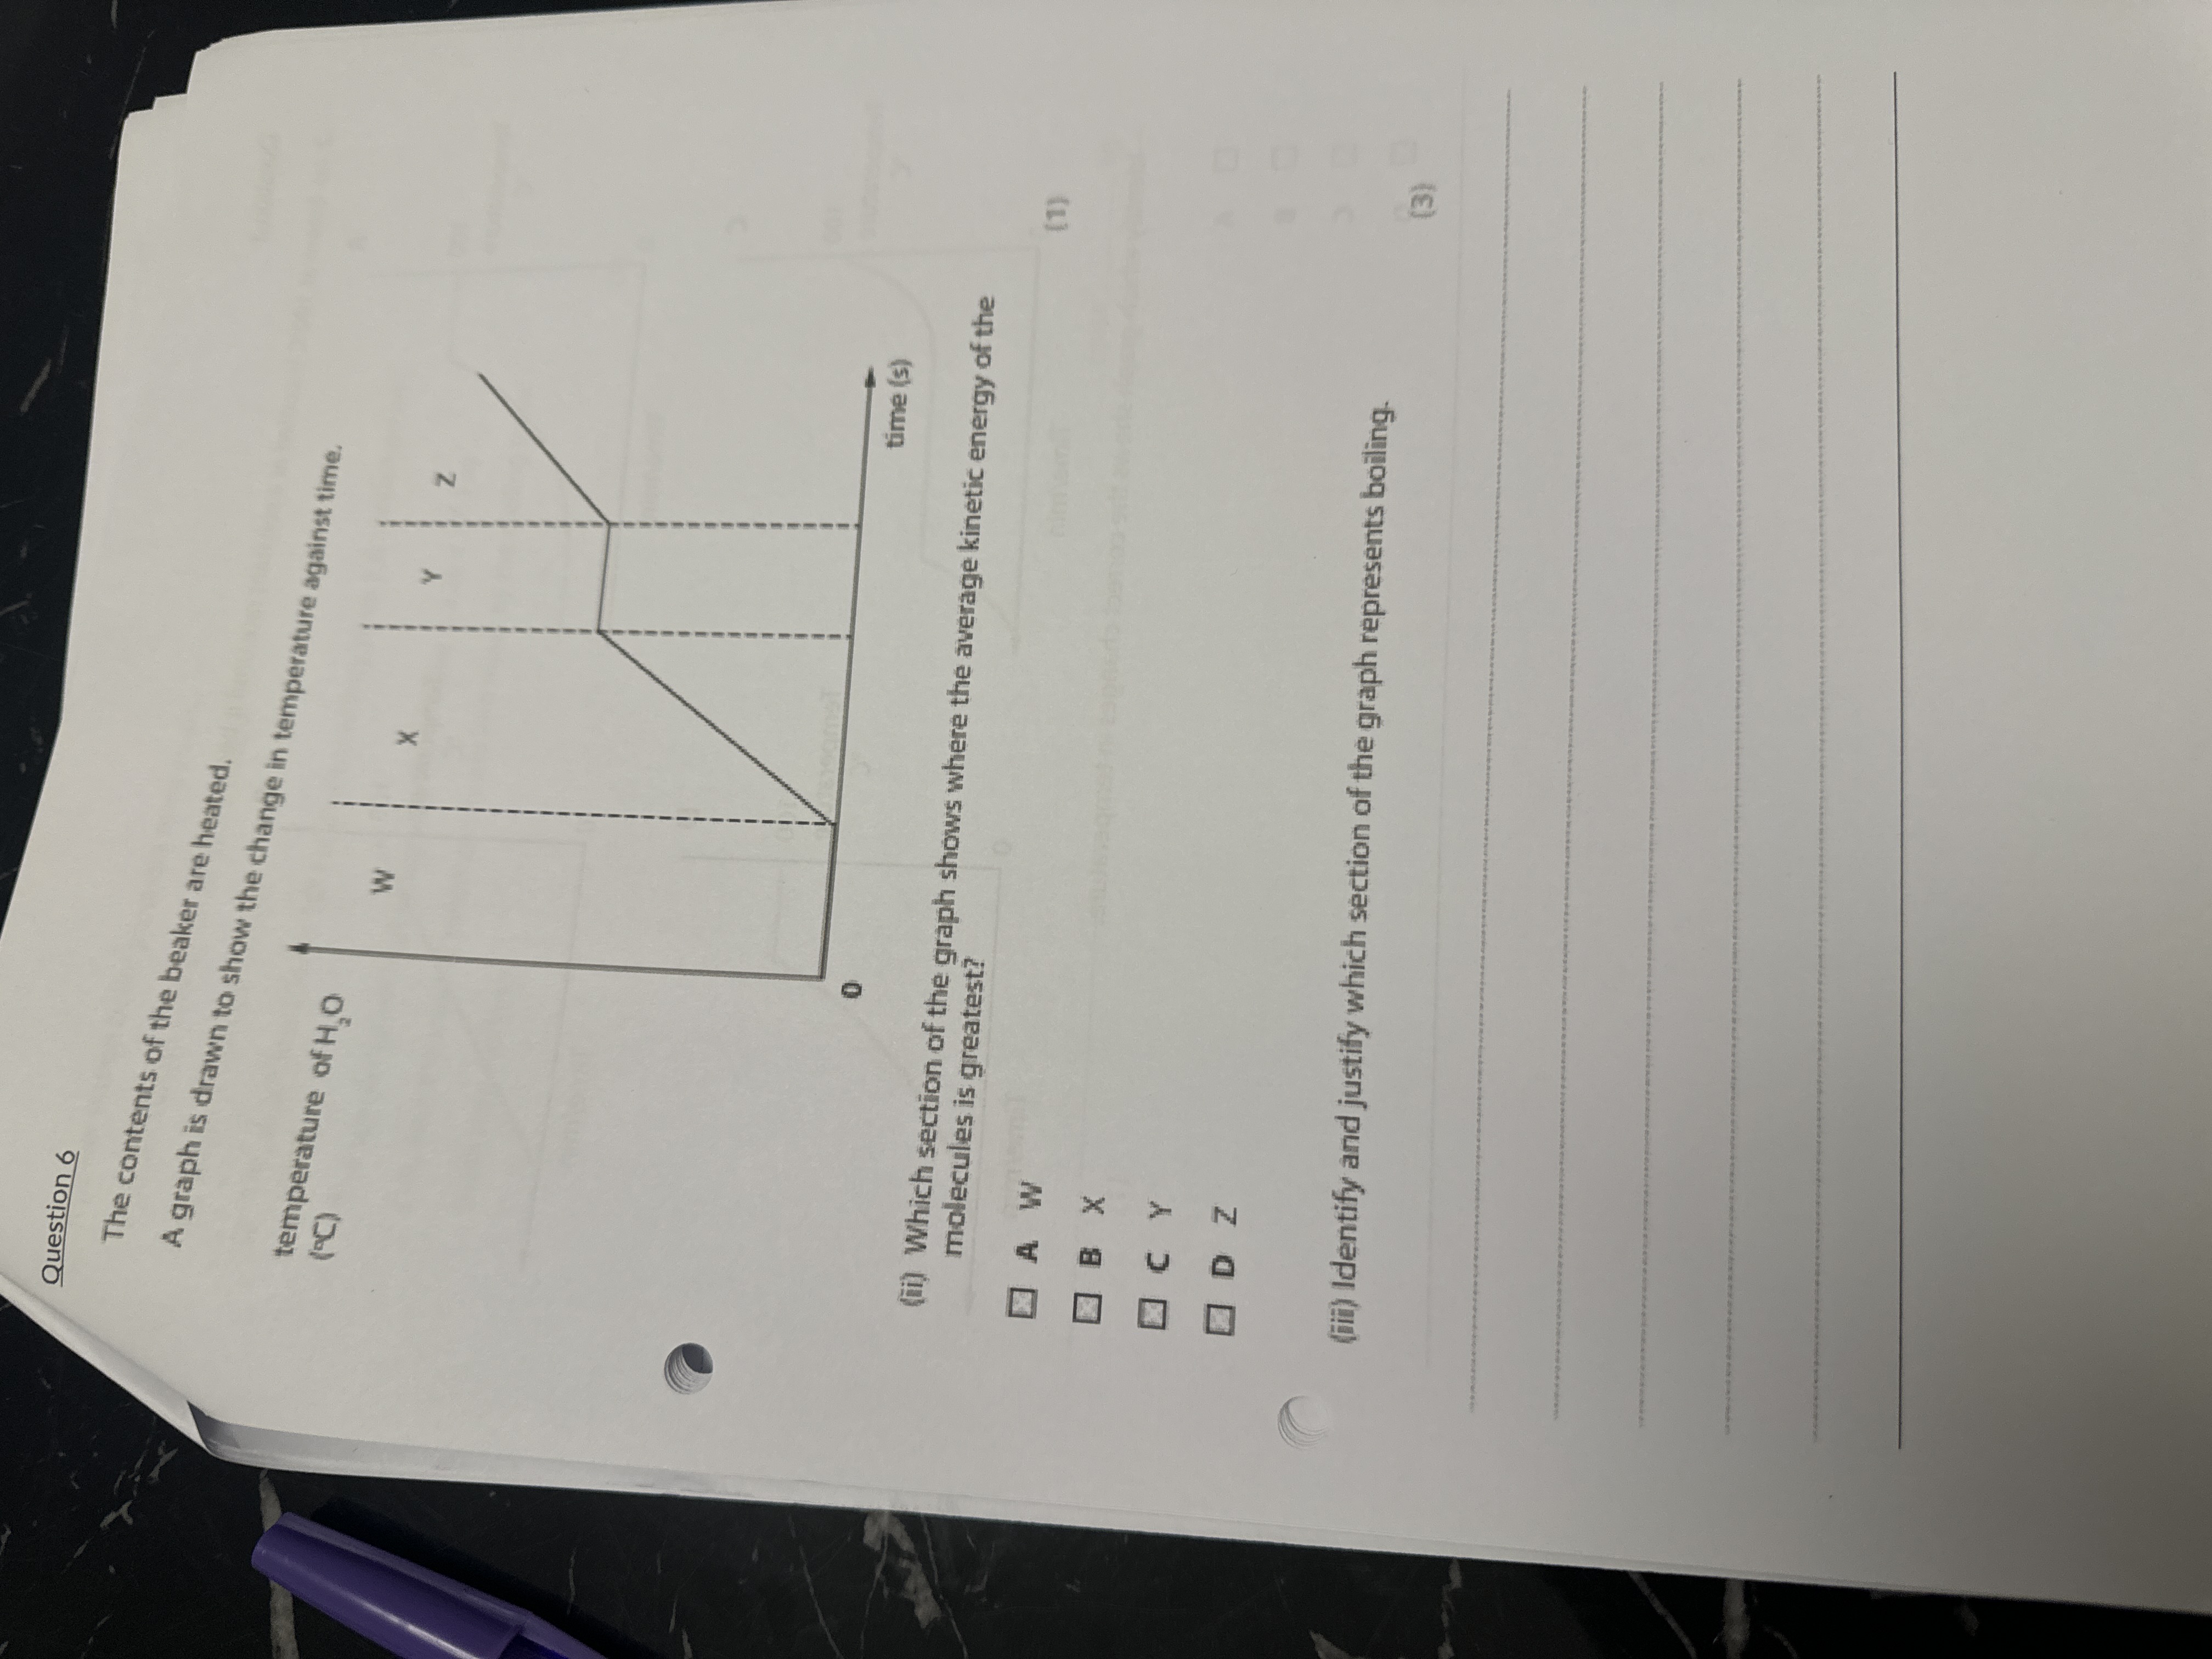
(ii) Which section of the graph shows where the average kinetic energy of the molecules is greatest? (iii) Identify and justify which section of the graph represents boiling.

Understand the Problem
The question is asking which section of a graph regarding temperature change of water represents the highest average kinetic energy of molecules and which section indicates boiling. This involves understanding the relationship between temperature and kinetic energy in the context of phase changes.
Answer
Z for greatest kinetic energy; Y for boiling (plateau).
The section of the graph where the average kinetic energy of molecules is greatest is Z. The section representing boiling is Y because it shows a plateau, indicating a phase change occurring at constant temperature.
Answer for screen readers
The section of the graph where the average kinetic energy of molecules is greatest is Z. The section representing boiling is Y because it shows a plateau, indicating a phase change occurring at constant temperature.
More Information
At a plateau on a temperature vs. time graph, energy is used for a phase change, not increasing temperature.
Tips
Confusing temperature with average kinetic energy; they're related but not identical during phase changes.
AI-generated content may contain errors. Please verify critical information