Identify and interpret the key functional groups present in Spectrum B, based on the provided IR spectrum.
Understand the Problem
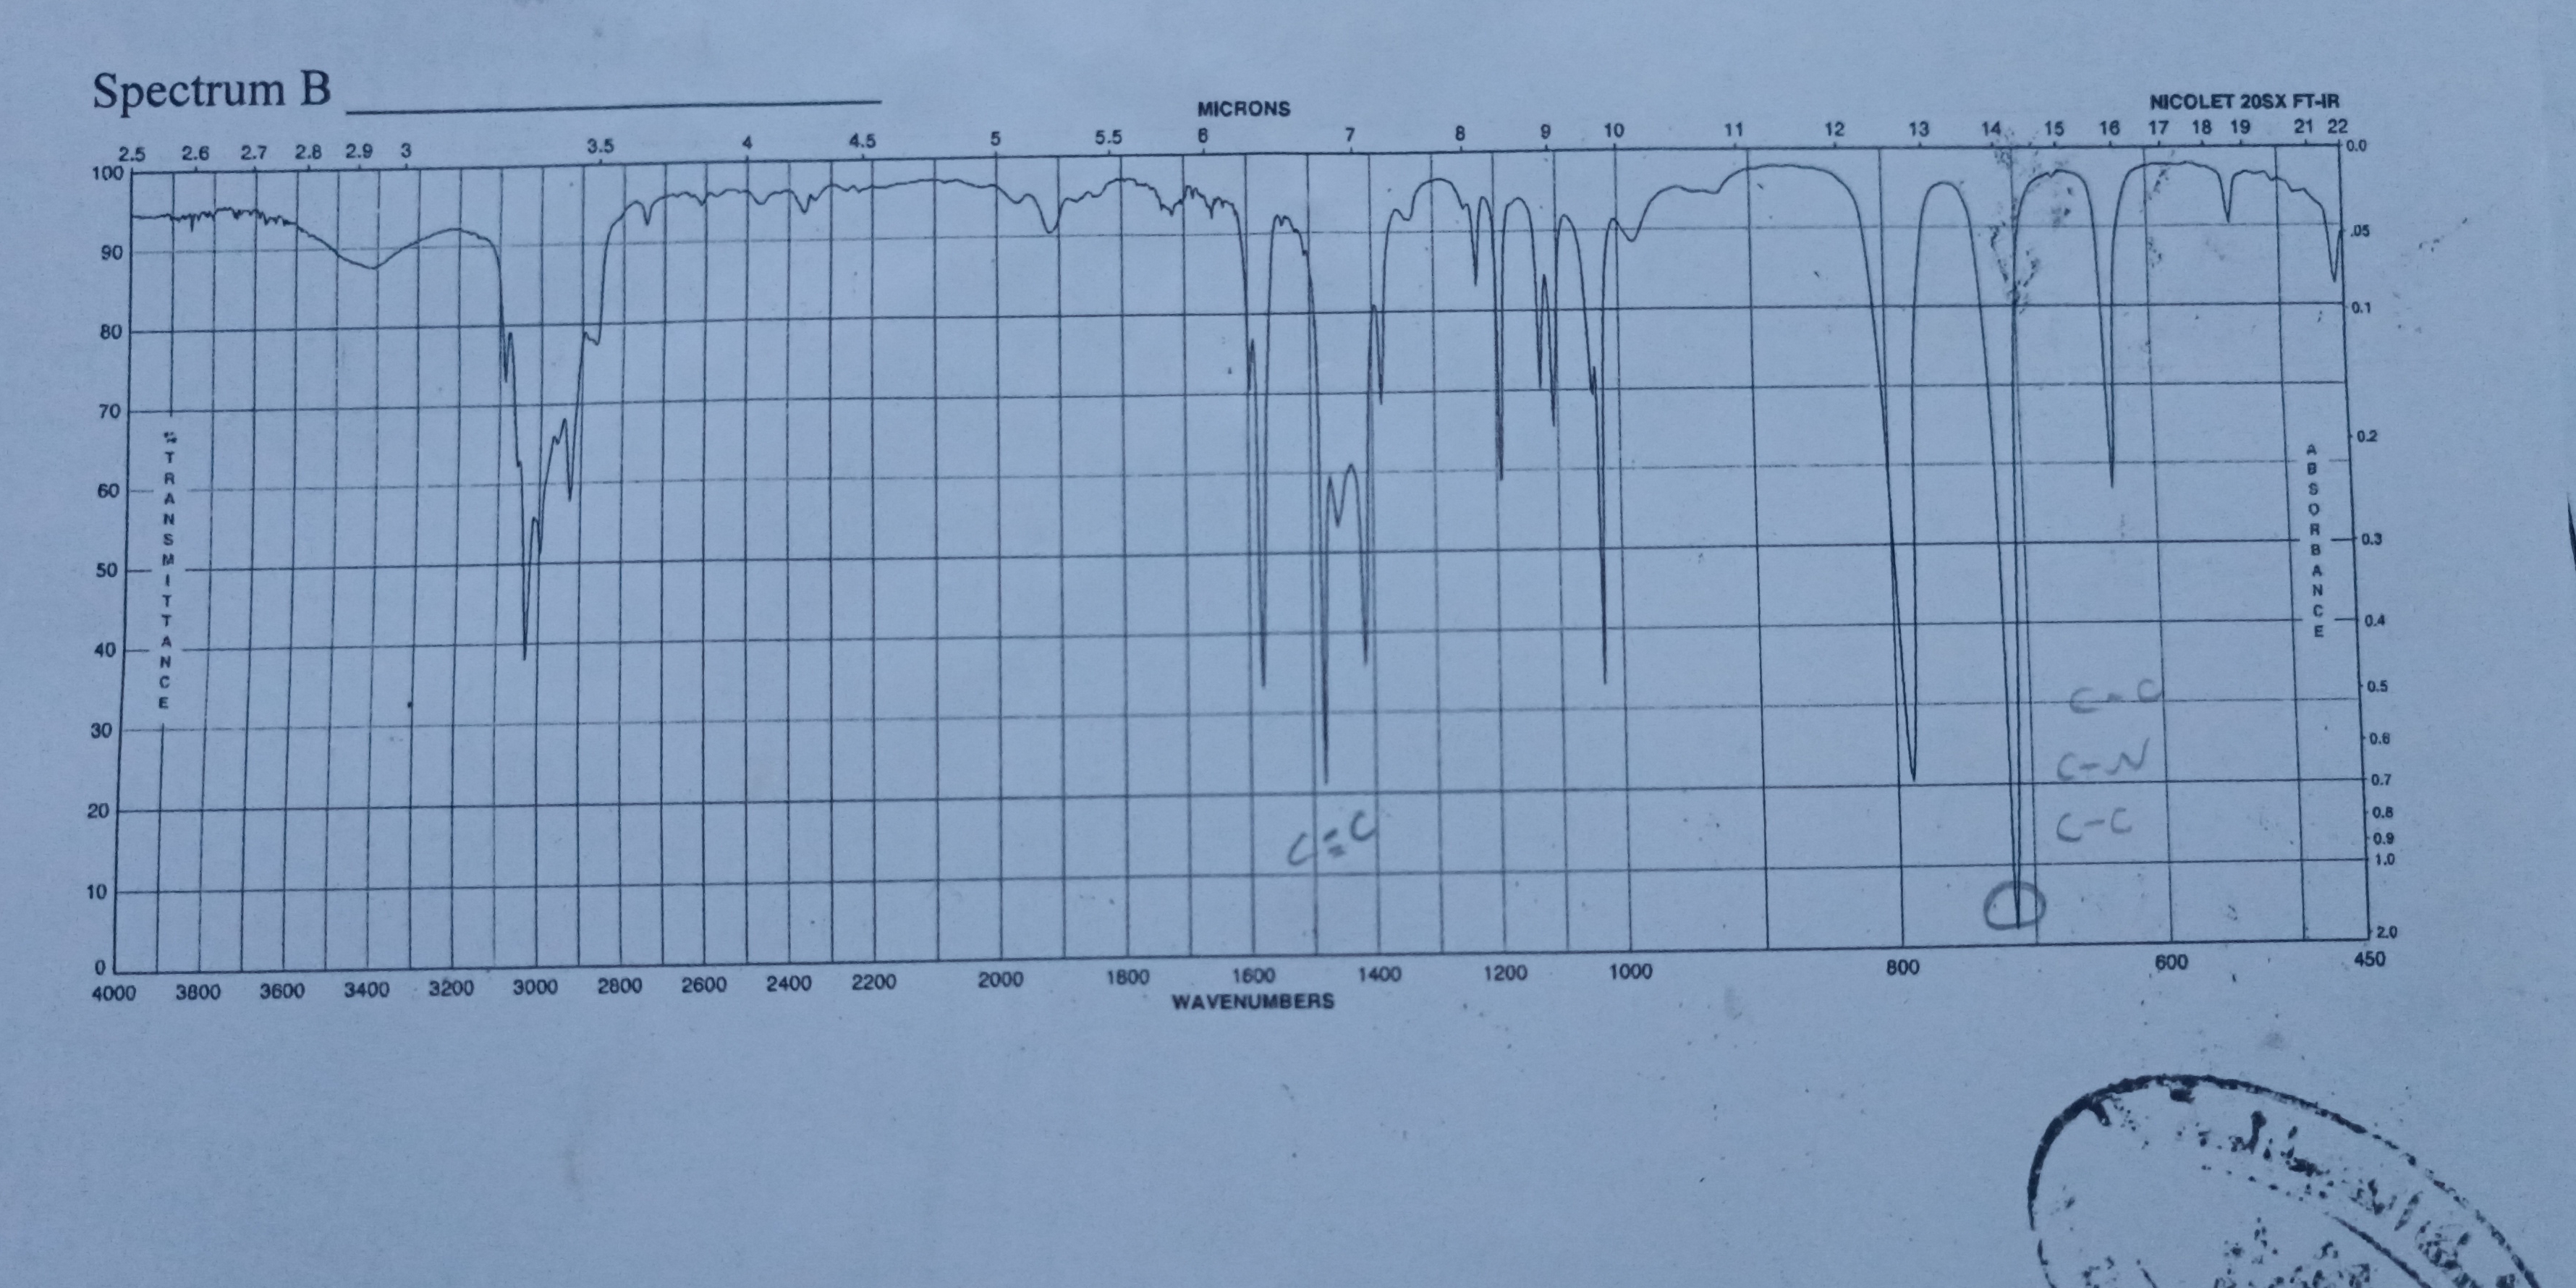
The image shows an IR spectrum, labelled Spectrum B. The x-axis represents wavenumbers (cm-1) and microns, while the y-axis shows the percent transmittance. The spectrum exhibits several peaks, indicating the absorption of infrared radiation at specific frequencies, which correspond to different functional groups within a molecule. It also labels the presence of C=C, C-O, C-N and C-C functional groups.
Answer
C=C, C-O, C-N, and C-C functional groups are present.
Based on the provided IR spectrum, the key functional groups present are: C=C, C-O, C-N, and C-C.
Answer for screen readers
Based on the provided IR spectrum, the key functional groups present are: C=C, C-O, C-N, and C-C.
More Information
An IR spectrum identifies the different bonds in a molecule. Each peak corresponds to a specific bond vibration.
Tips
When interpreting IR spectra:
- Focus on identifying major peaks.
- Use a reference table to correlate peak positions with functional groups.
Sources
- 4. 7 Identifying Characteristic Functional Groups - Chemistry LibreTexts - chem.libretexts.org
- 12.8: Infrared Spectra of Some Common Functional Groups - chem.libretexts.org
AI-generated content may contain errors. Please verify critical information