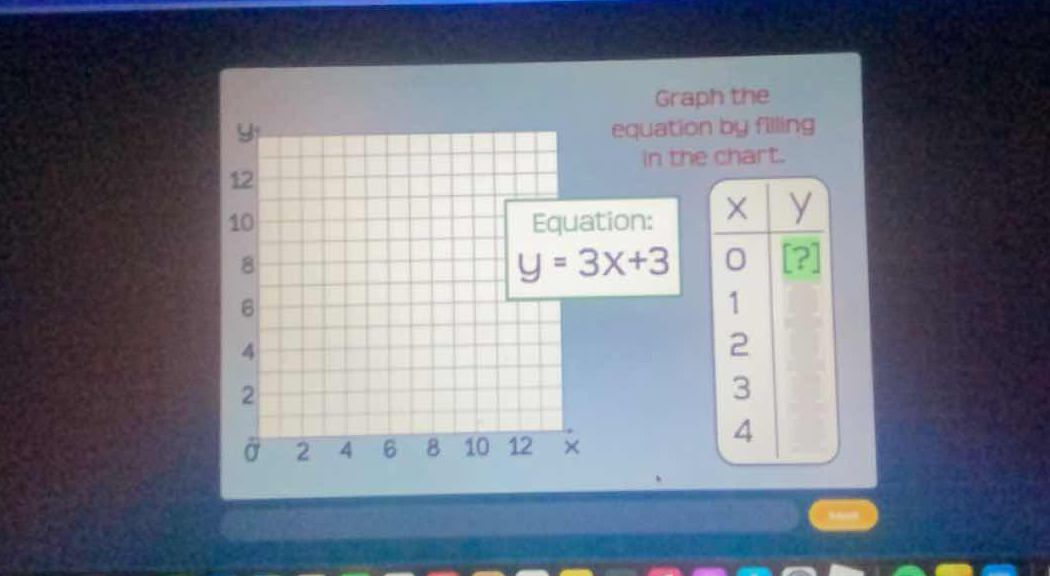
Graph the equation y = 3x + 3 by filling in the chart.
Understand the Problem
The question is asking to graph the equation y = 3x + 3 by filling in the corresponding y-values based on provided x-values in a chart. To do this, we will substitute the x-values into the equation to find y.
Answer
The corresponding y-values for the x-values 0, 1, 2, 3, and 4 are 3, 6, 9, 12, and 15, respectively for the equation $y = 3x + 3$.
Answer for screen readers
The filled chart with x and y values is:
X | Y
---------
0 | 3
1 | 6
2 | 9
3 | 12
4 | 15
Steps to Solve
-
Identify x-values
List the given x-values that we want to use in the equation. In this case, the x-values are 0, 1, 2, 3, and 4. -
Substitute x-values into the equation
We substitute each x-value into the equation $y = 3x + 3$ to find the corresponding y-values.-
For $x = 0$:
$$ y = 3(0) + 3 = 0 + 3 = 3 $$ -
For $x = 1$:
$$ y = 3(1) + 3 = 3 + 3 = 6 $$ -
For $x = 2$:
$$ y = 3(2) + 3 = 6 + 3 = 9 $$ -
For $x = 3$:
$$ y = 3(3) + 3 = 9 + 3 = 12 $$ -
For $x = 4$:
$$ y = 3(4) + 3 = 12 + 3 = 15 $$
-
-
Fill in the chart
Now that we have calculated the y-values, we can fill them into the chart corresponding to each x-value:- When $x = 0$, $y = 3$
- When $x = 1$, $y = 6$
- When $x = 2$, $y = 9$
- When $x = 3$, $y = 12$
- When $x = 4$, $y = 15$
The filled chart with x and y values is:
X | Y
---------
0 | 3
1 | 6
2 | 9
3 | 12
4 | 15
More Information
This equation represents a straight line with a slope of 3 and a y-intercept of 3. The values indicate how y changes as x increases, showing a consistent linear relationship.
Tips
- Miscalculating y-values: Always double-check the calculations when substituting values into the equation.
- Forgetting the order of operations: Ensure that multiplication is performed before addition.
AI-generated content may contain errors. Please verify critical information