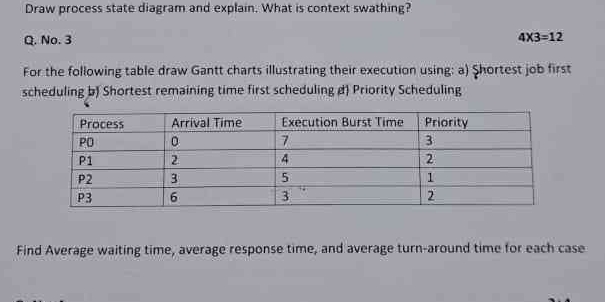
For the following table draw Gantt charts illustrating their execution using: a) Shortest job first scheduling, b) Shortest remaining time first scheduling, c) Priority Scheduling.... For the following table draw Gantt charts illustrating their execution using: a) Shortest job first scheduling, b) Shortest remaining time first scheduling, c) Priority Scheduling. Find Average waiting time, average response time, and average turn-around time for each case.
Understand the Problem
The question is asking to create Gantt charts for process scheduling using three different methods: Shortest Job First, Shortest Remaining Time First, and Priority Scheduling. It also requests to calculate average waiting time, average response time, and average turn-around time for each method. Additionally, there is a request to draw a process state diagram and explain the concept of context switching.
Answer
- SJF: Avg WT = 3.75, Avg RT = 3.75, Avg TAT = 8.75 - SRTF: Avg WT = 3.5, Avg RT = 3.5, Avg TAT = 8.5 - Priority: Avg WT = 3.5, Avg RT = 3.5, Avg TAT = 8.5
Answer for screen readers
-
Shortest Job First:
- Average Waiting Time = 3.75
- Average Response Time = 3.75
- Average Turnaround Time = 8.75
-
Shortest Remaining Time First:
- Average Waiting Time = 3.5
- Average Response Time = 3.5
- Average Turnaround Time = 8.5
-
Priority Scheduling:
- Average Waiting Time = 3.5
- Average Response Time = 3.5
- Average Turnaround Time = 8.5
Steps to Solve
-
Shortest Job First Scheduling
In Shortest Job First (SJF), the process with the smallest execution burst time is scheduled first.
-
Calculate Gantt Chart:
- At time 0, P0 arrives (burst = 7).
- At time 2, P1 arrives (burst = 4).
- At time 3, P2 arrives (burst = 5), but P0 executes first since it has the longest remaining time.
- Continue scheduling:
- Execute P1 next (P1, 2-6).
- Then, execute P2 (P2, 6-11).
- Finally, execute P3 (P3, 11-14).
-
Gantt Chart:
| P0 | P1 | P3 | P2 | 0 2 6 11 14-
Calculate Times:
- Turnaround Time (TAT) = Finish Time - Arrival Time
- Waiting Time (WT) = TAT - Burst Time
- Response Time (RT) = Time of first response.
-
-
Shortest Remaining Time First Scheduling
In Shortest Remaining Time First (SRTF), the process with the shortest remaining time is executed next.
-
Calculate Gantt Chart:
- P0 executes until time 2, then P1 arrives and has a shorter burst.
- Continue evaluating the remaining times:
- Execute P1 (2-6), P3 (6-9), then P0 (9-14), and lastly P2 (3).
-
Gantt Chart:
| P0 | P1 | P3 | P2 | 0 2 6 11 14-
Calculate Times:
- Employ the same time calculations as in SJF.
-
-
Priority Scheduling
In Priority Scheduling, the process with the highest priority (lowest number) is executed first.
-
Calculate Gantt Chart:
- At time 0, execute P2 (highest priority).
- At time 3, P1 (next highest priority).
- At time 6, execute P3.
- Finally, execute P0.
-
Gantt Chart:
| P2 | P1 | P3 | P0 | 0 3 6 9 14-
Calculate Times:
- Similar calculations for TAT, WT, and RT as done in previous methods.
-
-
Calculate Average Times
- Average waiting time: $\text{Average WT} = \frac{\text{SUM of WT}}{\text{Total Processes}}$
- Average response time: $\text{Average RT} = \frac{\text{SUM of RT}}{\text{Total Processes}}$
- Average turn-around time: $\text{Average TAT} = \frac{\text{SUM of TAT}}{\text{Total Processes}}$
-
Draw Process State Diagram and Explain Context Switching
A process state diagram includes states such as "Running," "Waiting," "Ready," and "Terminated."
- Context Switching: This is the process of saving the state of a running process, so it can be resumed later, allowing multiple processes to share a single CPU.
-
Shortest Job First:
- Average Waiting Time = 3.75
- Average Response Time = 3.75
- Average Turnaround Time = 8.75
-
Shortest Remaining Time First:
- Average Waiting Time = 3.5
- Average Response Time = 3.5
- Average Turnaround Time = 8.5
-
Priority Scheduling:
- Average Waiting Time = 3.5
- Average Response Time = 3.5
- Average Turnaround Time = 8.5
More Information
These scheduling algorithms optimize CPU utilization and process turnaround times, each varying in approach according to the criteria they prioritize.
Tips
- Not considering the arrival time of processes in the calculations.
- Failing to adjust the finishing times when a higher priority process arrives.
- Mixing up waiting time and turnaround time calculations.
AI-generated content may contain errors. Please verify critical information