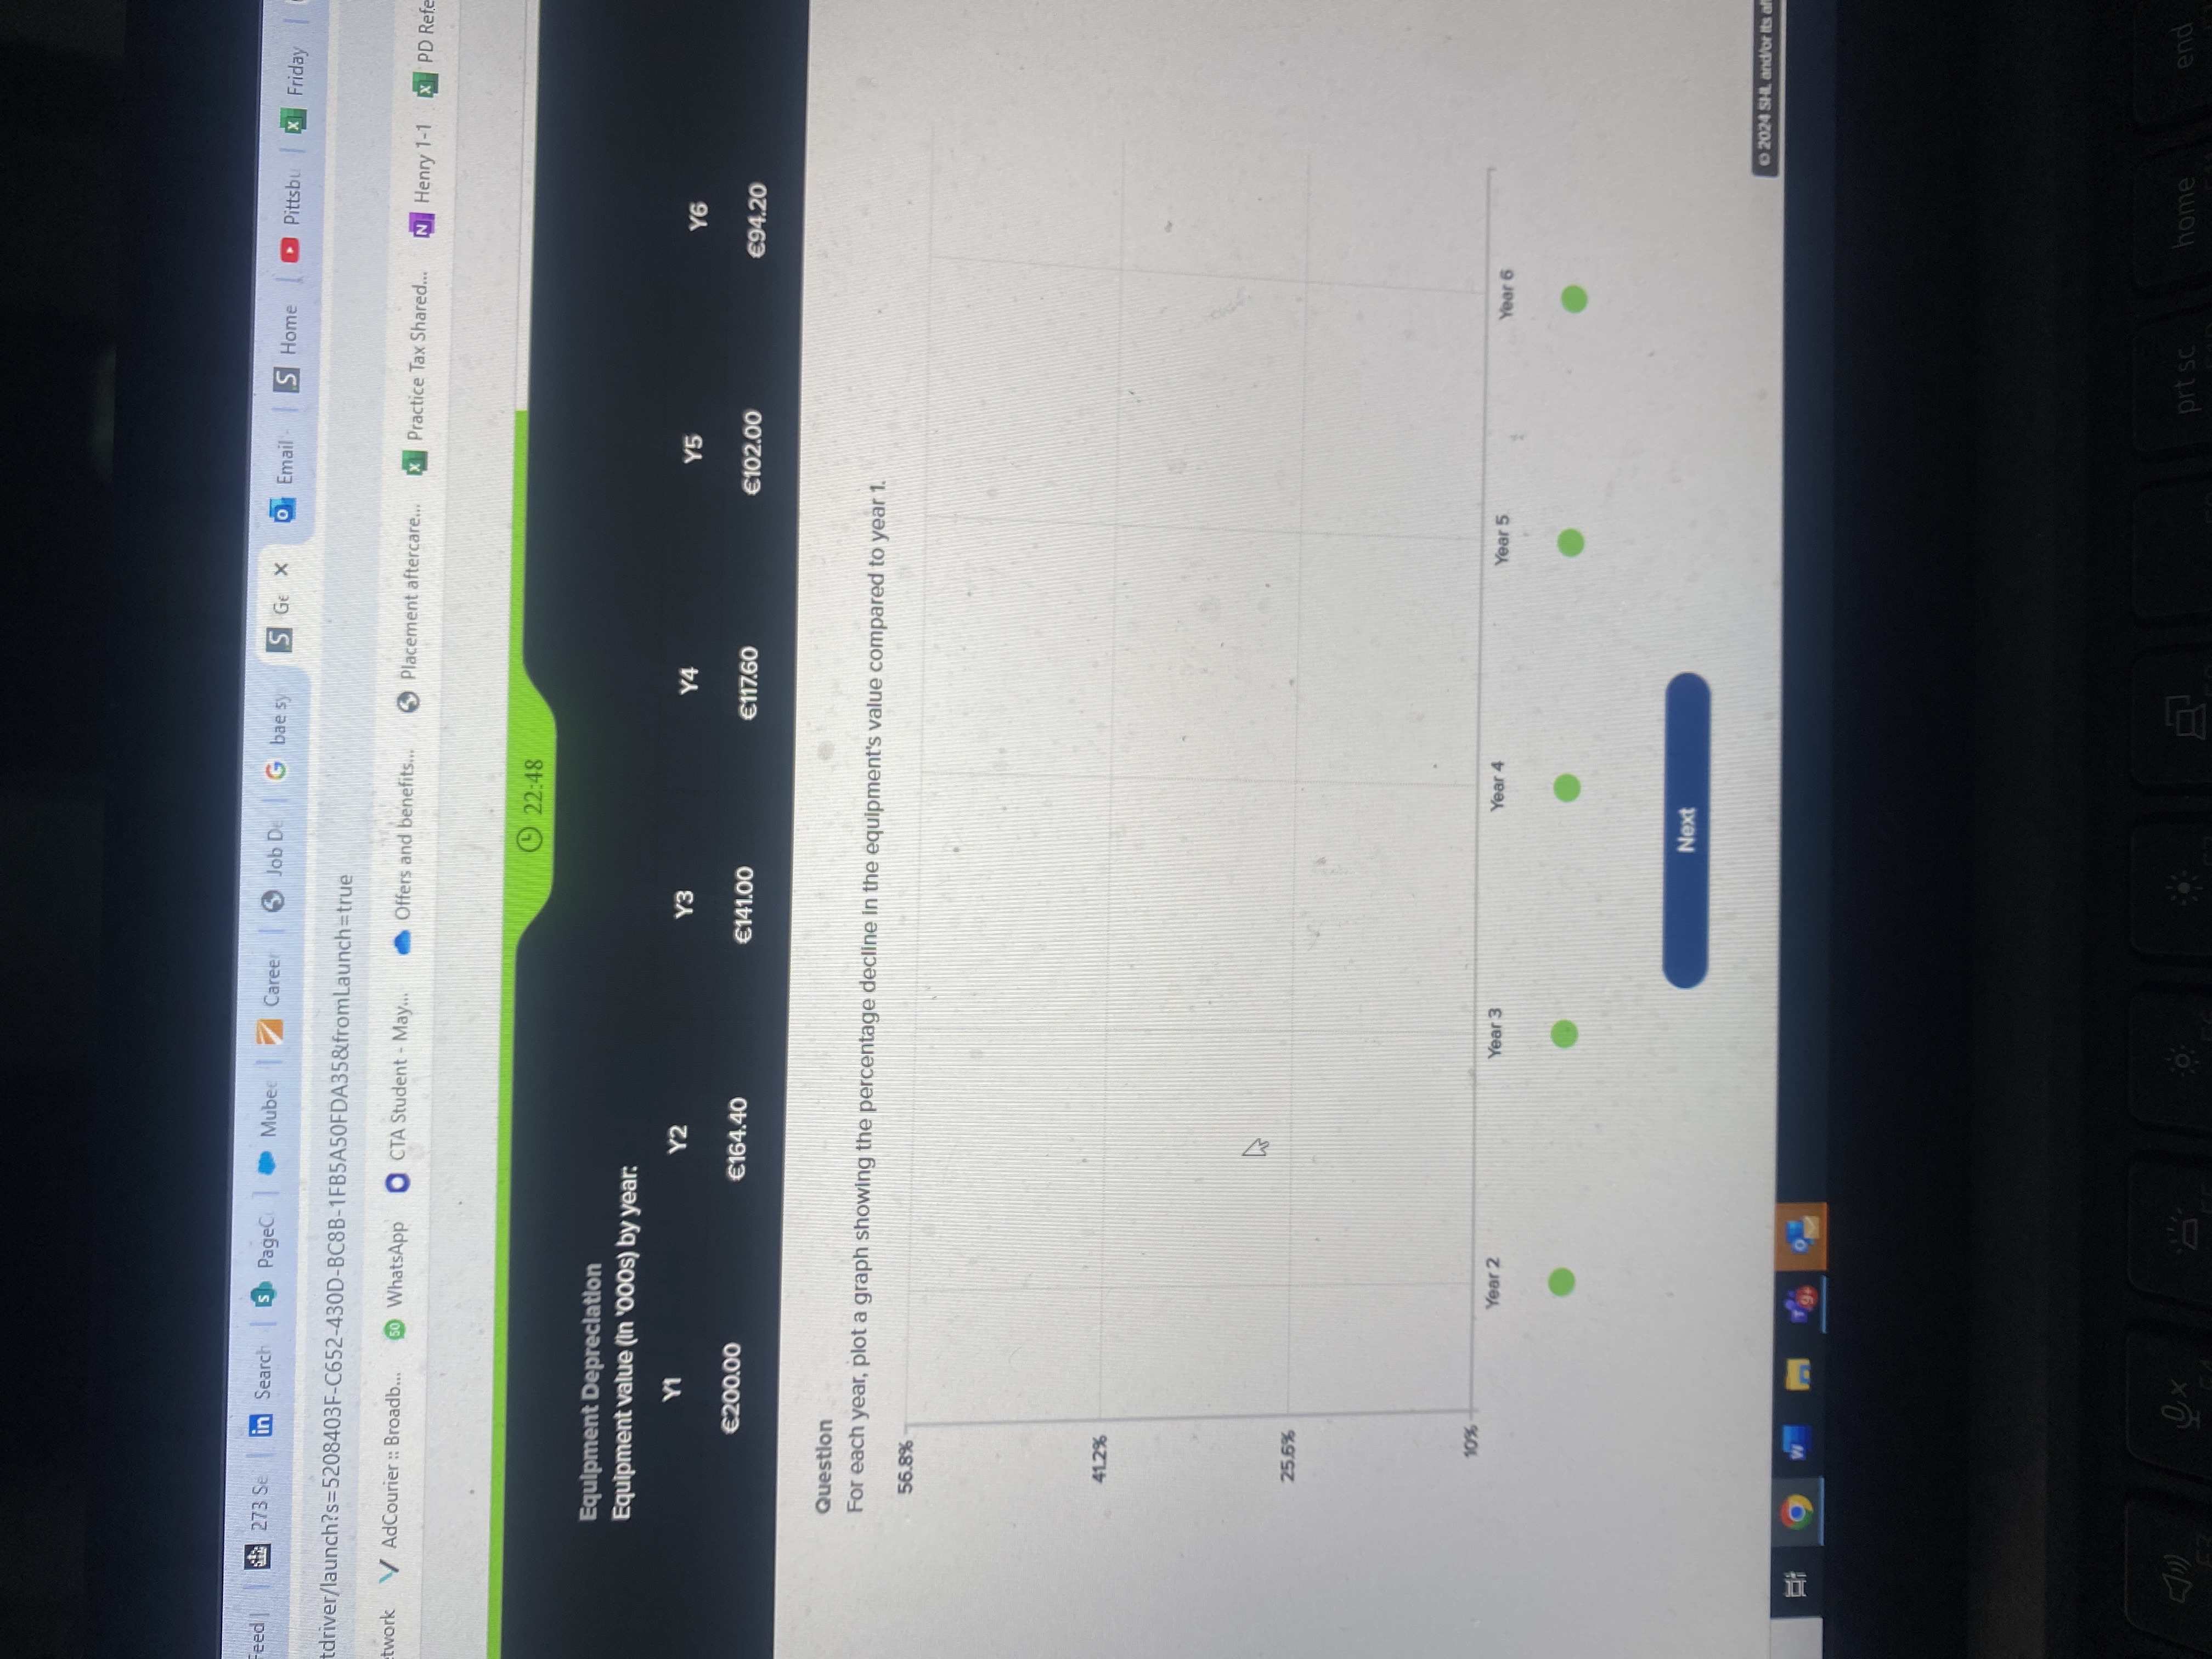
For each year, plot a graph showing the percentage decline in the equipment's value compared to year 1.
Understand the Problem
The question is asking for a graphical representation of the percentage decline in equipment value compared to the first year, based on provided values for subsequent years (Y2 to Y6). We will calculate the percentage decline for each year and create a plot accordingly.
Answer
Percentage declines compared to Year 1: Year 2: $17.8\%$, Year 3: $29.5\%$, Year 4: $41.2\%$, Year 5: $49\%$, Year 6: $52.9\%$.
Answer for screen readers
The percentage declines in equipment value compared to Year 1 are:
- Year 2: 17.8%
- Year 3: 29.5%
- Year 4: 41.2%
- Year 5: 49%
- Year 6: 52.9%
Steps to Solve
-
Identify Equipment Values The values of the equipment for each year are as follows:
- Year 1: $200.00
- Year 2: $164.40
- Year 3: $141.00
- Year 4: $117.60
- Year 5: $102.00
- Year 6: $94.20
-
Calculate Percentage Decline for Each Year The formula to calculate the percentage decline compared to Year 1 is: $$ \text{Percentage Decline} = \left( \frac{\text{Value in Year 1} - \text{Value in Current Year}}{\text{Value in Year 1}} \right) \times 100 $$
Now we can calculate for each year:
- Year 2: $$ \text{Decline} = \left( \frac{200 - 164.40}{200} \right) \times 100 = 17.8% $$
- Year 3: $$ \text{Decline} = \left( \frac{200 - 141}{200} \right) \times 100 = 29.5% $$
- Year 4: $$ \text{Decline} = \left( \frac{200 - 117.60}{200} \right) \times 100 = 41.2% $$
- Year 5: $$ \text{Decline} = \left( \frac{200 - 102}{200} \right) \times 100 = 49% $$
- Year 6: $$ \text{Decline} = \left( \frac{200 - 94.20}{200} \right) \times 100 = 52.9% $$
-
Compile Results into a List The percentage declines for each year, compared to Year 1, are:
- Year 2: 17.8%
- Year 3: 29.5%
- Year 4: 41.2%
- Year 5: 49%
- Year 6: 52.9%
-
Graph the Results To plot the graph, take the percentage declines calculated and label the x-axis as "Years" (Year 2 to Year 6) and the y-axis as "Percentage Decline (%)". Mark each point corresponding to the percentage decline for each respective year.
The percentage declines in equipment value compared to Year 1 are:
- Year 2: 17.8%
- Year 3: 29.5%
- Year 4: 41.2%
- Year 5: 49%
- Year 6: 52.9%
More Information
These calculations reflect the depreciation of the equipment over six years. A graphical representation helps visualize how quickly the equipment's value decreases over time.
Tips
- Forgetting to multiply by 100 when converting to a percentage.
- Miscalculating the initial value in the formula, leading to incorrect percentages.
- Confusing the current year value with the Year 1 value.
AI-generated content may contain errors. Please verify critical information