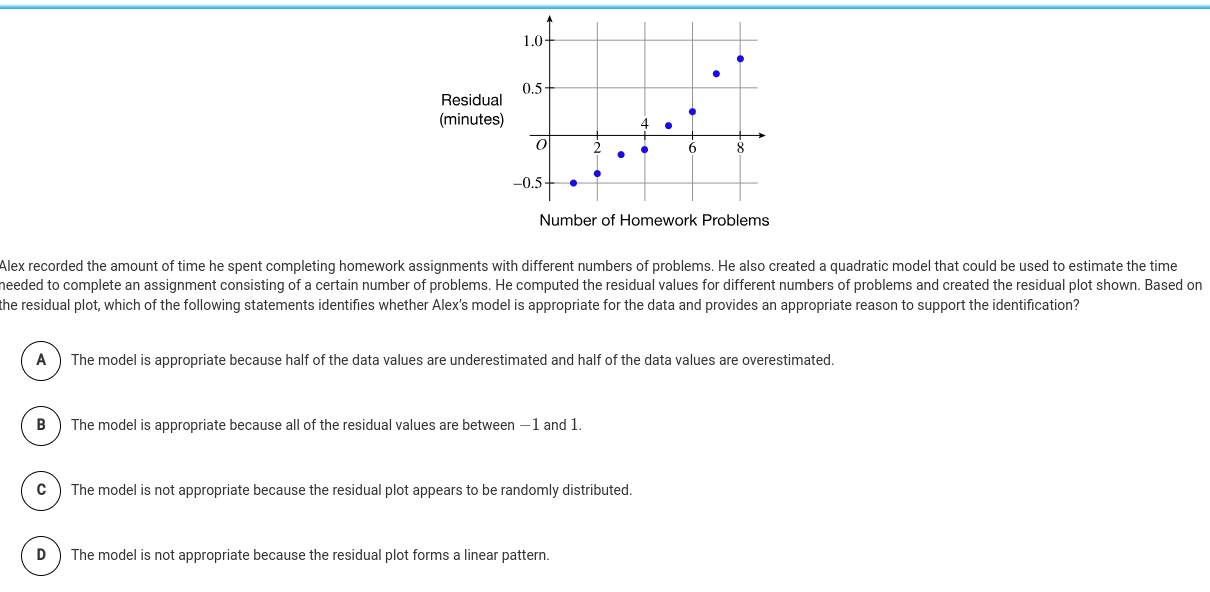
Based on the residual plot shown, which of the following statements identifies whether Alex's model is appropriate for the data and provides an appropriate reason to support the id... Based on the residual plot shown, which of the following statements identifies whether Alex's model is appropriate for the data and provides an appropriate reason to support the identification?
Understand the Problem
The question asks which statement best identifies the appropriateness of a quadratic model based on the provided residual plot for homework assignment times. We need to analyze the residual plot and evaluate the different statements provided to determine which one accurately reflects the model's performance.
Answer
B: The model is appropriate because all of the residual values are between $-1$ and $1$.
Answer for screen readers
The model is appropriate because all of the residual values are between $-1$ and $1$. Thus, the correct answer is B.
Steps to Solve
-
Understand the Residual Plot The residual plot shows the difference between observed and predicted values. A good model should have residuals randomly distributed around zero.
-
Analyze the Statements Look at each of the statements provided:
- Statement A: Claims the model is appropriate based on over- and underestimations.
- Statement B: States the model is appropriate because the residuals lie between -1 and 1.
- Statement C: Suggests that if residuals are randomly distributed, the model is not appropriate.
- Statement D: Claims the model isn’t appropriate because residuals form a linear pattern.
-
Evaluate the Residuals Since the residuals shown in the plot do not exhibit a clear pattern and are randomly scattered, we can infer that the quadratic model should be considered appropriate.
-
Determine the Correct Statement Based on the analysis, we can assess the validity of each statement. Residuals that are not forming a systematic pattern indicate a good fit.
-
Choose the Best Description Among the options, select the statement that best describes the appropriateness of the model based on the residual plot.
The model is appropriate because all of the residual values are between $-1$ and $1$. Thus, the correct answer is B.
More Information
When a quadratic model accurately represents the data, the residual values should ideally hover close to zero without showing any patterns. Statement B supports this idea effectively.
Tips
- Misinterpreting the residuals: Some may incorrectly assume that any non-zero values mean the model is inappropriate.
- Overlooking the distribution pattern: It's crucial to assess whether the residuals display any systematic patterns or trends before deeming the model valid or invalid.
AI-generated content may contain errors. Please verify critical information