Attached image of a candlestick chart.
Understand the Problem
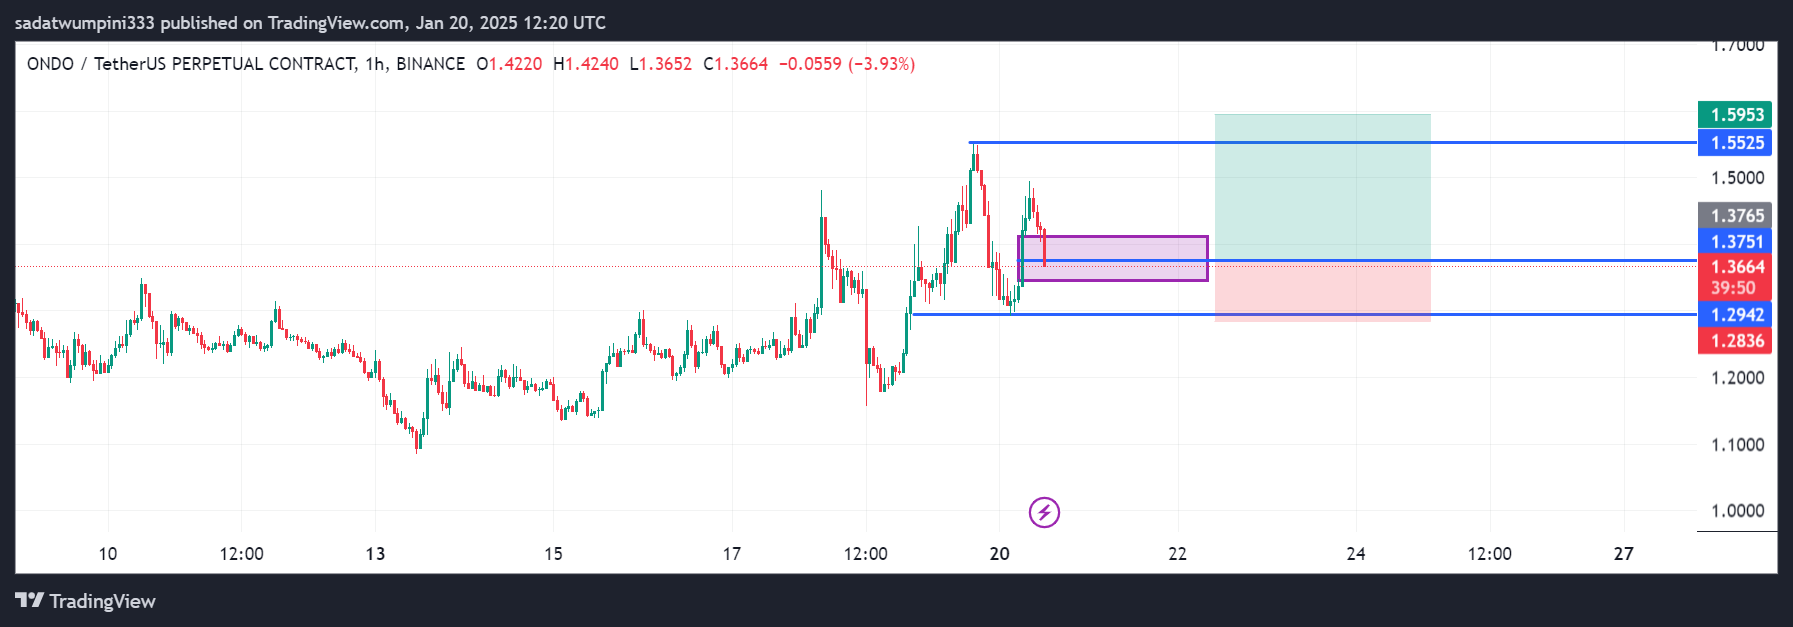
The image shows a candlestick chart for ONDO/TetherUS perpetual contract on Binance, with annotations indicating potential support and resistance levels, as well as entry and exit points for a trade.
Answer
Candlestick chart for ONDO/TetherUS perpetual contract on Binance, 1-hour timeframe, published on January 20, 2025. The closing price was 1.3664, representing a -3.93% change.
The image is of a candlestick chart for ONDO/TetherUS perpetual contract on Binance, as published on TradingView.com on January 20, 2025. The time frame is 1 hour. At the time of publication, the opening price was 1.4220, the high was 1.4240, the low was 1.3652, and the closing price was 1.3664, representing a -3.93% change.
Answer for screen readers
The image is of a candlestick chart for ONDO/TetherUS perpetual contract on Binance, as published on TradingView.com on January 20, 2025. The time frame is 1 hour. At the time of publication, the opening price was 1.4220, the high was 1.4240, the low was 1.3652, and the closing price was 1.3664, representing a -3.93% change.
More Information
Candlestick charts are used in financial analysis to visualize price movements over time. Each candlestick represents the price range for a specific period.
Tips
It is important to understand the context of the chart to make informed decisions.
Sources
- What is a Candlestick Chart? - Jaspersoft - jaspersoft.com
- Candlestick Chart - Learn about this chart and tools to create it - datavizcatalogue.com
- Candlestick chart - Highcharts - highcharts.com
AI-generated content may contain errors. Please verify critical information