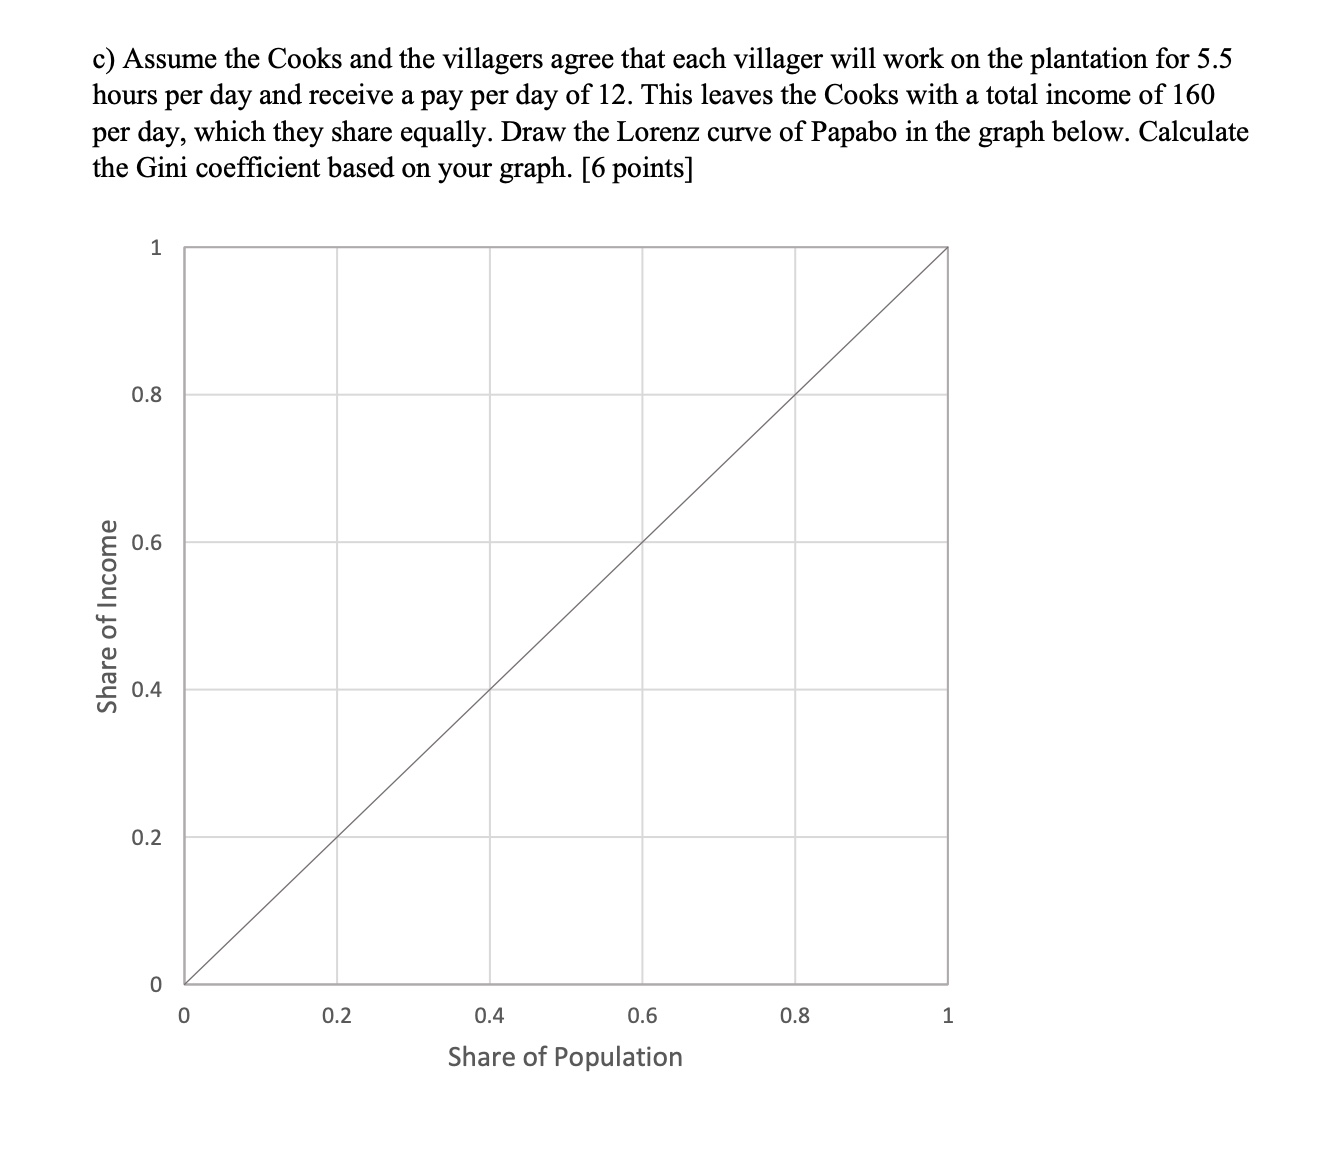
Assume the Cooks and the villagers agree that each villager will work on the plantation for 5.5 hours per day and receive a pay per day of 12. This leaves the Cooks with a total in... Assume the Cooks and the villagers agree that each villager will work on the plantation for 5.5 hours per day and receive a pay per day of 12. This leaves the Cooks with a total income of 160 per day, which they share equally. Draw the Lorenz curve of Papabo in the graph below. Calculate the Gini coefficient based on your graph. [6 points]

Understand the Problem
The question is asking us to construct a Lorenz curve based on the income distribution of a group, then calculate the Gini coefficient from that graph. This involves understanding the concepts of income distribution and graphical representation of inequality.
Answer
Draw the Lorenz curve and calculate Gini as twice the area between curve and equality line.
The Lorenz curve shows income distribution inequality, and the Gini coefficient measures this inequality. For example, if there are 10 equal part earners and the total is distributed to cooks and villagers, plot cumulative shares to form the Lorenz curve. Gini uses the area beneath this versus the line of equality.
Answer for screen readers
The Lorenz curve shows income distribution inequality, and the Gini coefficient measures this inequality. For example, if there are 10 equal part earners and the total is distributed to cooks and villagers, plot cumulative shares to form the Lorenz curve. Gini uses the area beneath this versus the line of equality.
More Information
The Lorenz curve represents inequality, and the Gini coefficient quantifies it, ranging from 0 (perfect equality) to 1 (maximum inequality). Here, the Gini coefficient helps visualize income sharing between villagers and cooks.
Tips
Common mistakes include incorrect calculations of area for the Gini coefficient or misplotting cumulative shares on the Lorenz curve.
AI-generated content may contain errors. Please verify critical information