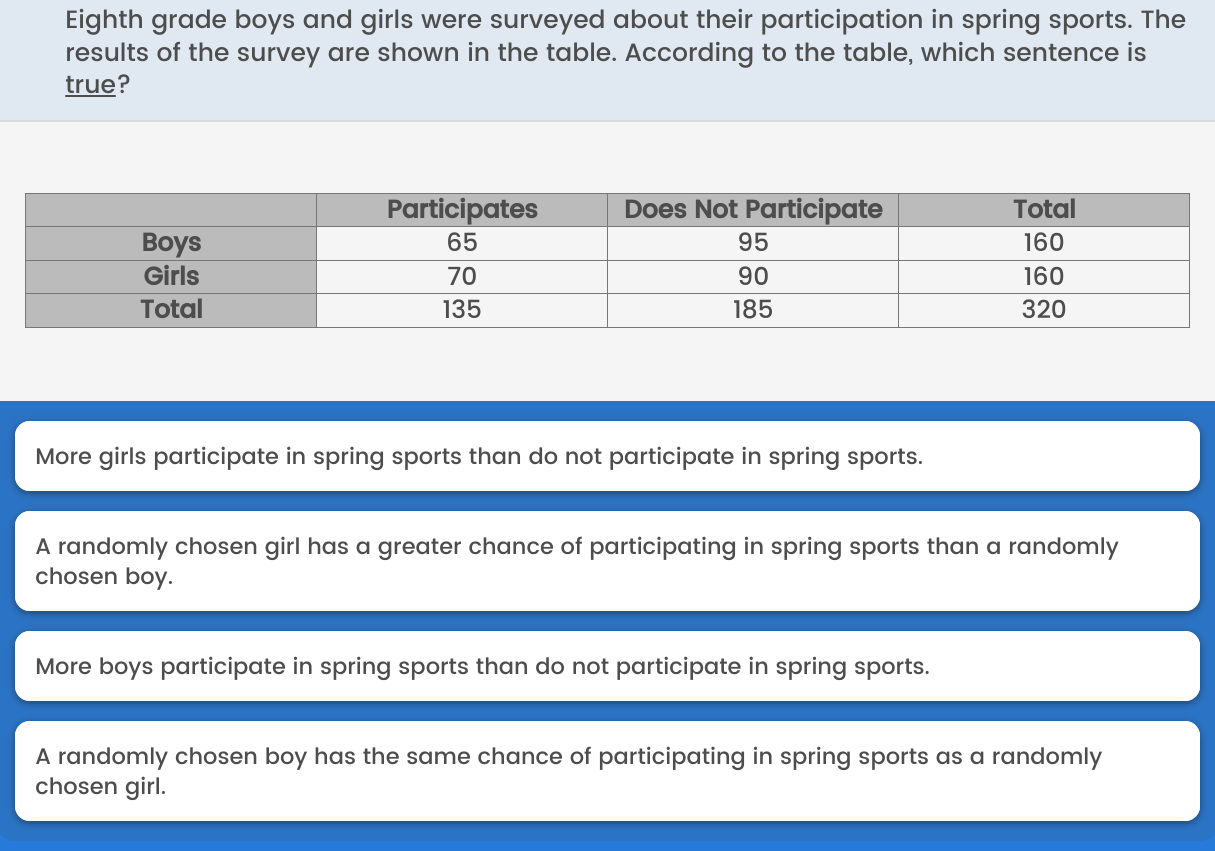
According to the table, which sentence is true?

Understand the Problem
The question is asking to analyze the participation rates of boys and girls in spring sports based on a provided survey table. It seeks to determine which of the given statements is true according to the data.
Answer
A randomly chosen girl has a greater chance of participating in spring sports than a randomly chosen boy.
Answer for screen readers
The true statement is: A randomly chosen girl has a greater chance of participating in spring sports than a randomly chosen boy.
Steps to Solve
-
Review Participation Rates for Boys and Girls
From the table, we see:- Boys participating in spring sports: 65
- Boys not participating: 95
- Total boys: 160
- Girls participating in spring sports: 70
- Girls not participating: 90
- Total girls: 160
-
Calculate Participation Percentages for Boys and Girls
Calculate the participation rate for boys and girls:
For boys:
$$ \text{Participation Rate (Boys)} = \frac{65}{160} \approx 0.40625 \text{ or } 40.63% $$
For girls:
$$ \text{Participation Rate (Girls)} = \frac{70}{160} \approx 0.4375 \text{ or } 43.75% $$ -
Analyze Each Statement
-
Statement 1: More girls participate in spring sports than do not participate.
Participation for girls: 70, Non-participation: 90 (False) -
Statement 2: A randomly chosen girl has a greater chance of participating than a randomly chosen boy.
Compare rates to see 43.75% vs 40.63% (True) -
Statement 3: More boys participate in spring sports than do not participate.
Participation for boys: 65, Non-participation: 95 (False) -
Statement 4: A randomly chosen boy has the same chance of participating as a randomly chosen girl.
40.63% vs 43.75% (False)
-
Statement 1: More girls participate in spring sports than do not participate.
-
Identify the True Statement
After analysis, only Statement 2 is true.
The true statement is: A randomly chosen girl has a greater chance of participating in spring sports than a randomly chosen boy.
More Information
This analysis highlights gender differences in participation rates in school sports, which may be influenced by various factors such as social norms, interests, or availability of sports.
Tips
- Failing to correctly interpret percentages when comparing participation rates. Ensure you perform accurate calculations and comparison.
- Not double-checking the values in the survey table leading to incorrect conclusions.
AI-generated content may contain errors. Please verify critical information