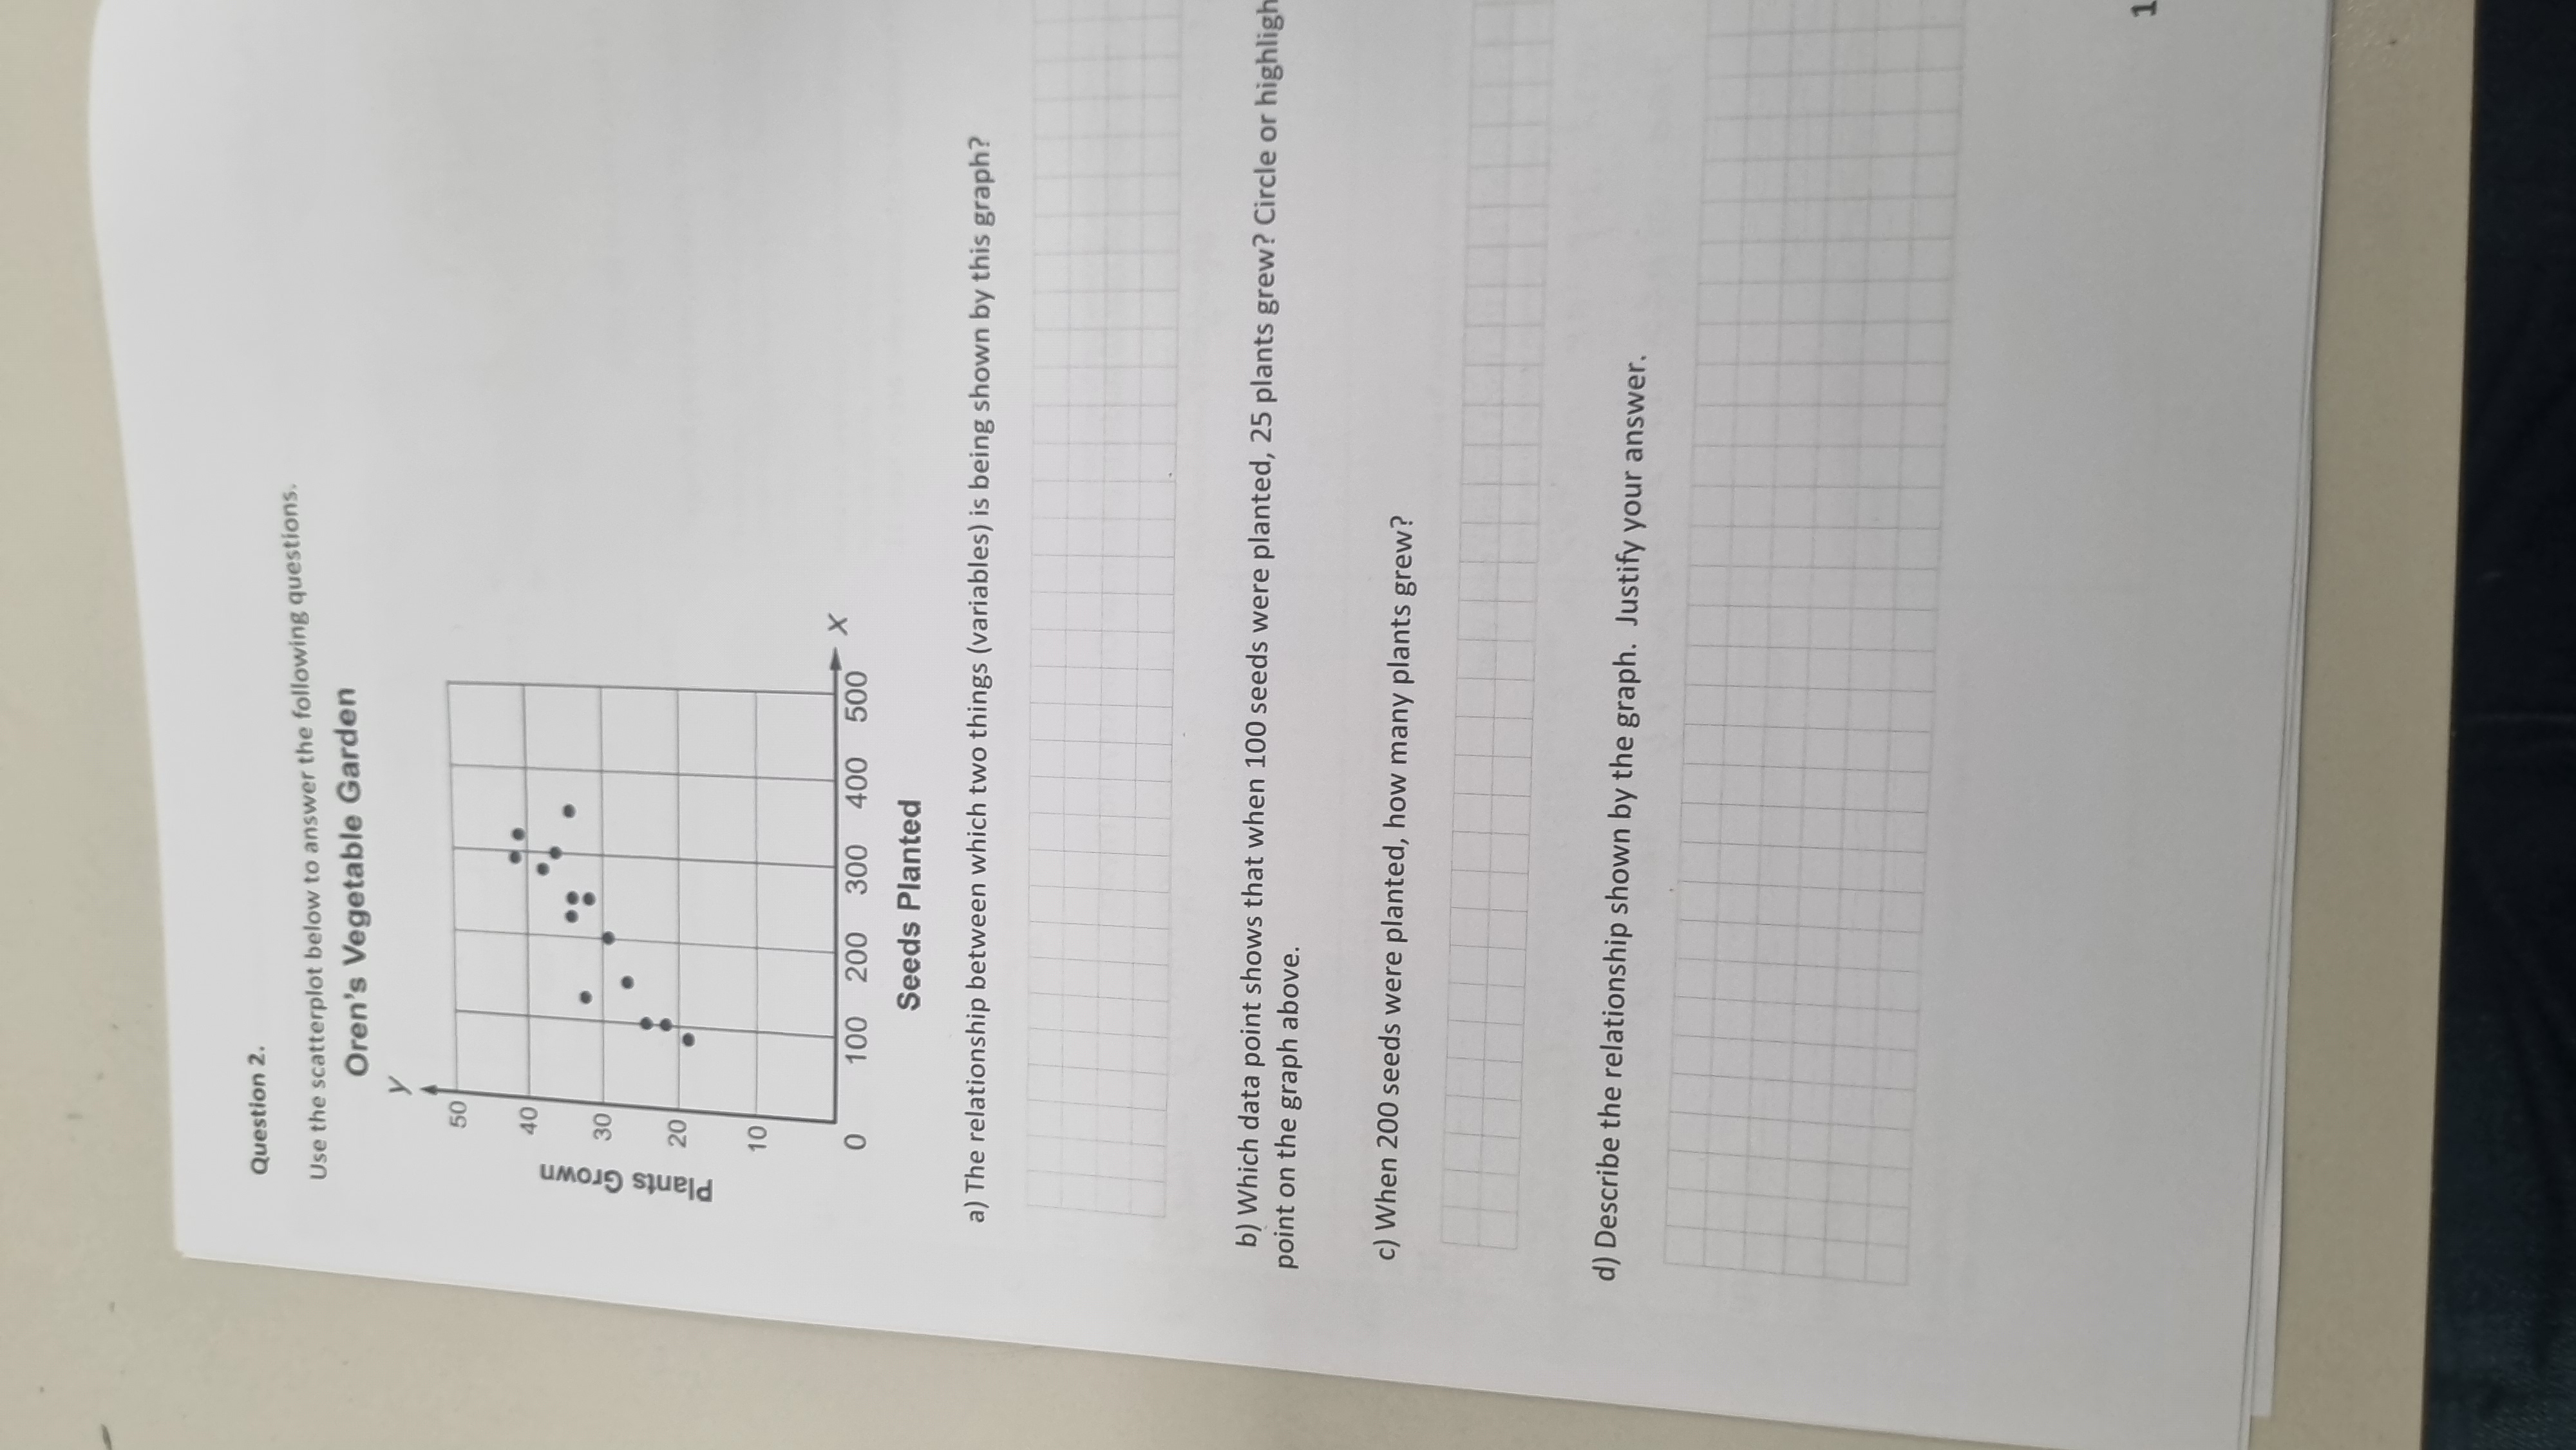
a) The relationship between which two things (variables) is being shown by this graph? b) Which data point shows that when 100 seeds were planted, 25 plants grew? c) When 200 seeds... a) The relationship between which two things (variables) is being shown by this graph? b) Which data point shows that when 100 seeds were planted, 25 plants grew? c) When 200 seeds were planted, how many plants grew? d) Describe the relationship shown by the graph. Justify your answer.

Understand the Problem
The question is asking for an analysis of a scatterplot related to a vegetable garden's growth based on the number of seeds planted. It requires identifying the variables represented by the graph, analyzing specific data points, and describing the overall relationship shown by the graph.
Answer
a) Seeds planted vs. plants grown; b) (100, 25); c) 10 plants; d) Negative relationship.
Answer for screen readers
a) The relationship shown by the graph is between the number of seeds planted (x-axis) and the number of plants grown (y-axis).
b) The data point for 100 seeds is approximately (100, 25).
c) For 200 seeds planted, the corresponding number of plants grown is approximately 10.
d) The overall relationship is negative; as the number of seeds planted increases, the number of plants grown tends to decrease.
Steps to Solve
-
Identify the Variables
The scatterplot represents two variables: the number of seeds planted (x-axis) and the number of plants grown (y-axis). -
Analyzing a Data Point
To find the data point that shows when 100 seeds were planted, locate the point corresponding to 100 on the x-axis. See the corresponding value on the y-axis. -
Finding the Value for 200 Seeds
Look for the point where the x-value is 200. Check the y-axis to see how many plants grew at this number of seeds. -
Describe the Overall Relationship
By observing the scatterplot, determine if there's a positive, negative, or no correlation between the number of seeds planted and the growth of plants. Note that as the number of seeds planted increases, the number of plants grown may decrease or have no clear trend.
a) The relationship shown by the graph is between the number of seeds planted (x-axis) and the number of plants grown (y-axis).
b) The data point for 100 seeds is approximately (100, 25).
c) For 200 seeds planted, the corresponding number of plants grown is approximately 10.
d) The overall relationship is negative; as the number of seeds planted increases, the number of plants grown tends to decrease.
More Information
This analysis is important in horticulture for understanding optimal planting strategies, helping to maximize plant growth while minimizing seed waste.
Tips
- Misreading the axes: Always double-check the values on the x and y-axis.
- Assuming a linear relationship without analyzing the scatter: Take note of the spread of data points.
- Overlooking the importance of specific data points: Data points provide critical insights about specific conditions.
AI-generated content may contain errors. Please verify critical information