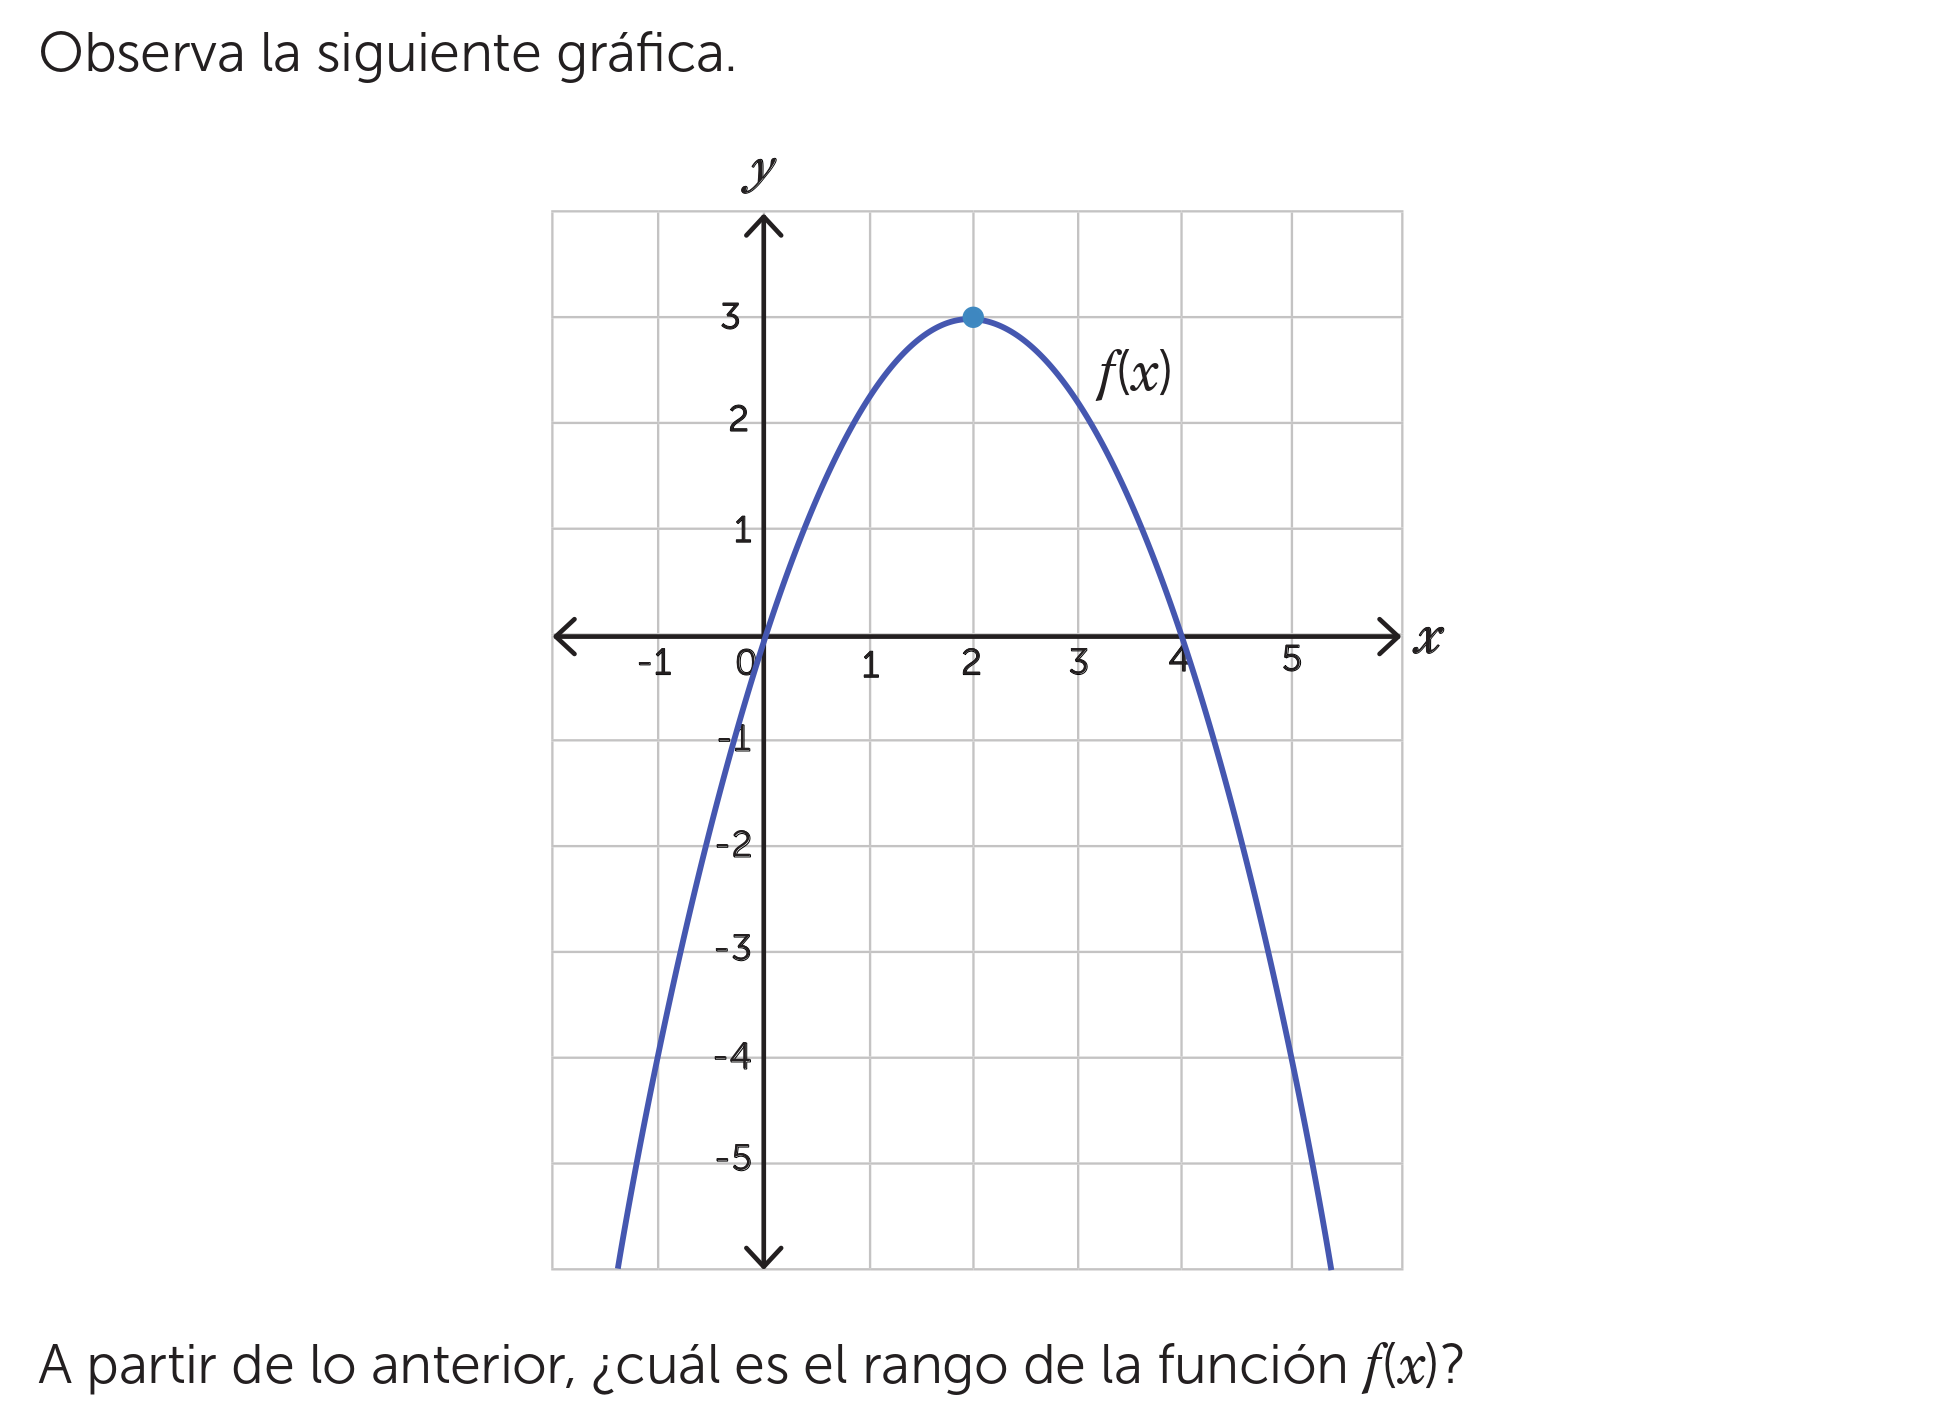
A partir de la gráfica, ¿cuál es el rango de la función f(x)?
Understand the Problem
La pregunta te pide determinar el rango de la función f(x) basándote en la gráfica proporcionada. El rango de una función es el conjunto de todos los valores de salida posibles (valores de 'y') que la función puede tomar.
Answer
$(-\infty, 3]$
Answer for screen readers
$(-\infty, 3]$
Steps to Solve
- Identify the minimum y-value
The lowest value that the function reaches extends to negative infinity, $ -\infty $.
- Identify the maximum y-value
The function reaches a maximum y-value at the vertex of the parabola. From the graph, the vertex appears to be at $y = 3$.
- Express the range
The range includes all $y$-values from negative infinity up to and including 3. Therefore, the range is $ (-\infty, 3]$.
$(-\infty, 3]$
More Information
The range signifies the set of all possible output values of a function. In this case, the function extends downwards indefinitely, but has an upper bound at $y = 3$.
Tips
A common mistake would be to confuse range and domain. The domain is the set of input values (x-values) and the range is the set of output values (y-values). Another common mistake is to use the incorrect notation for interval i.e. using brackets $()$ instead of square brackets $[]$ where appropriate. In this example, 3 is included in the range, hence square bracket must be used for this value.
AI-generated content may contain errors. Please verify critical information