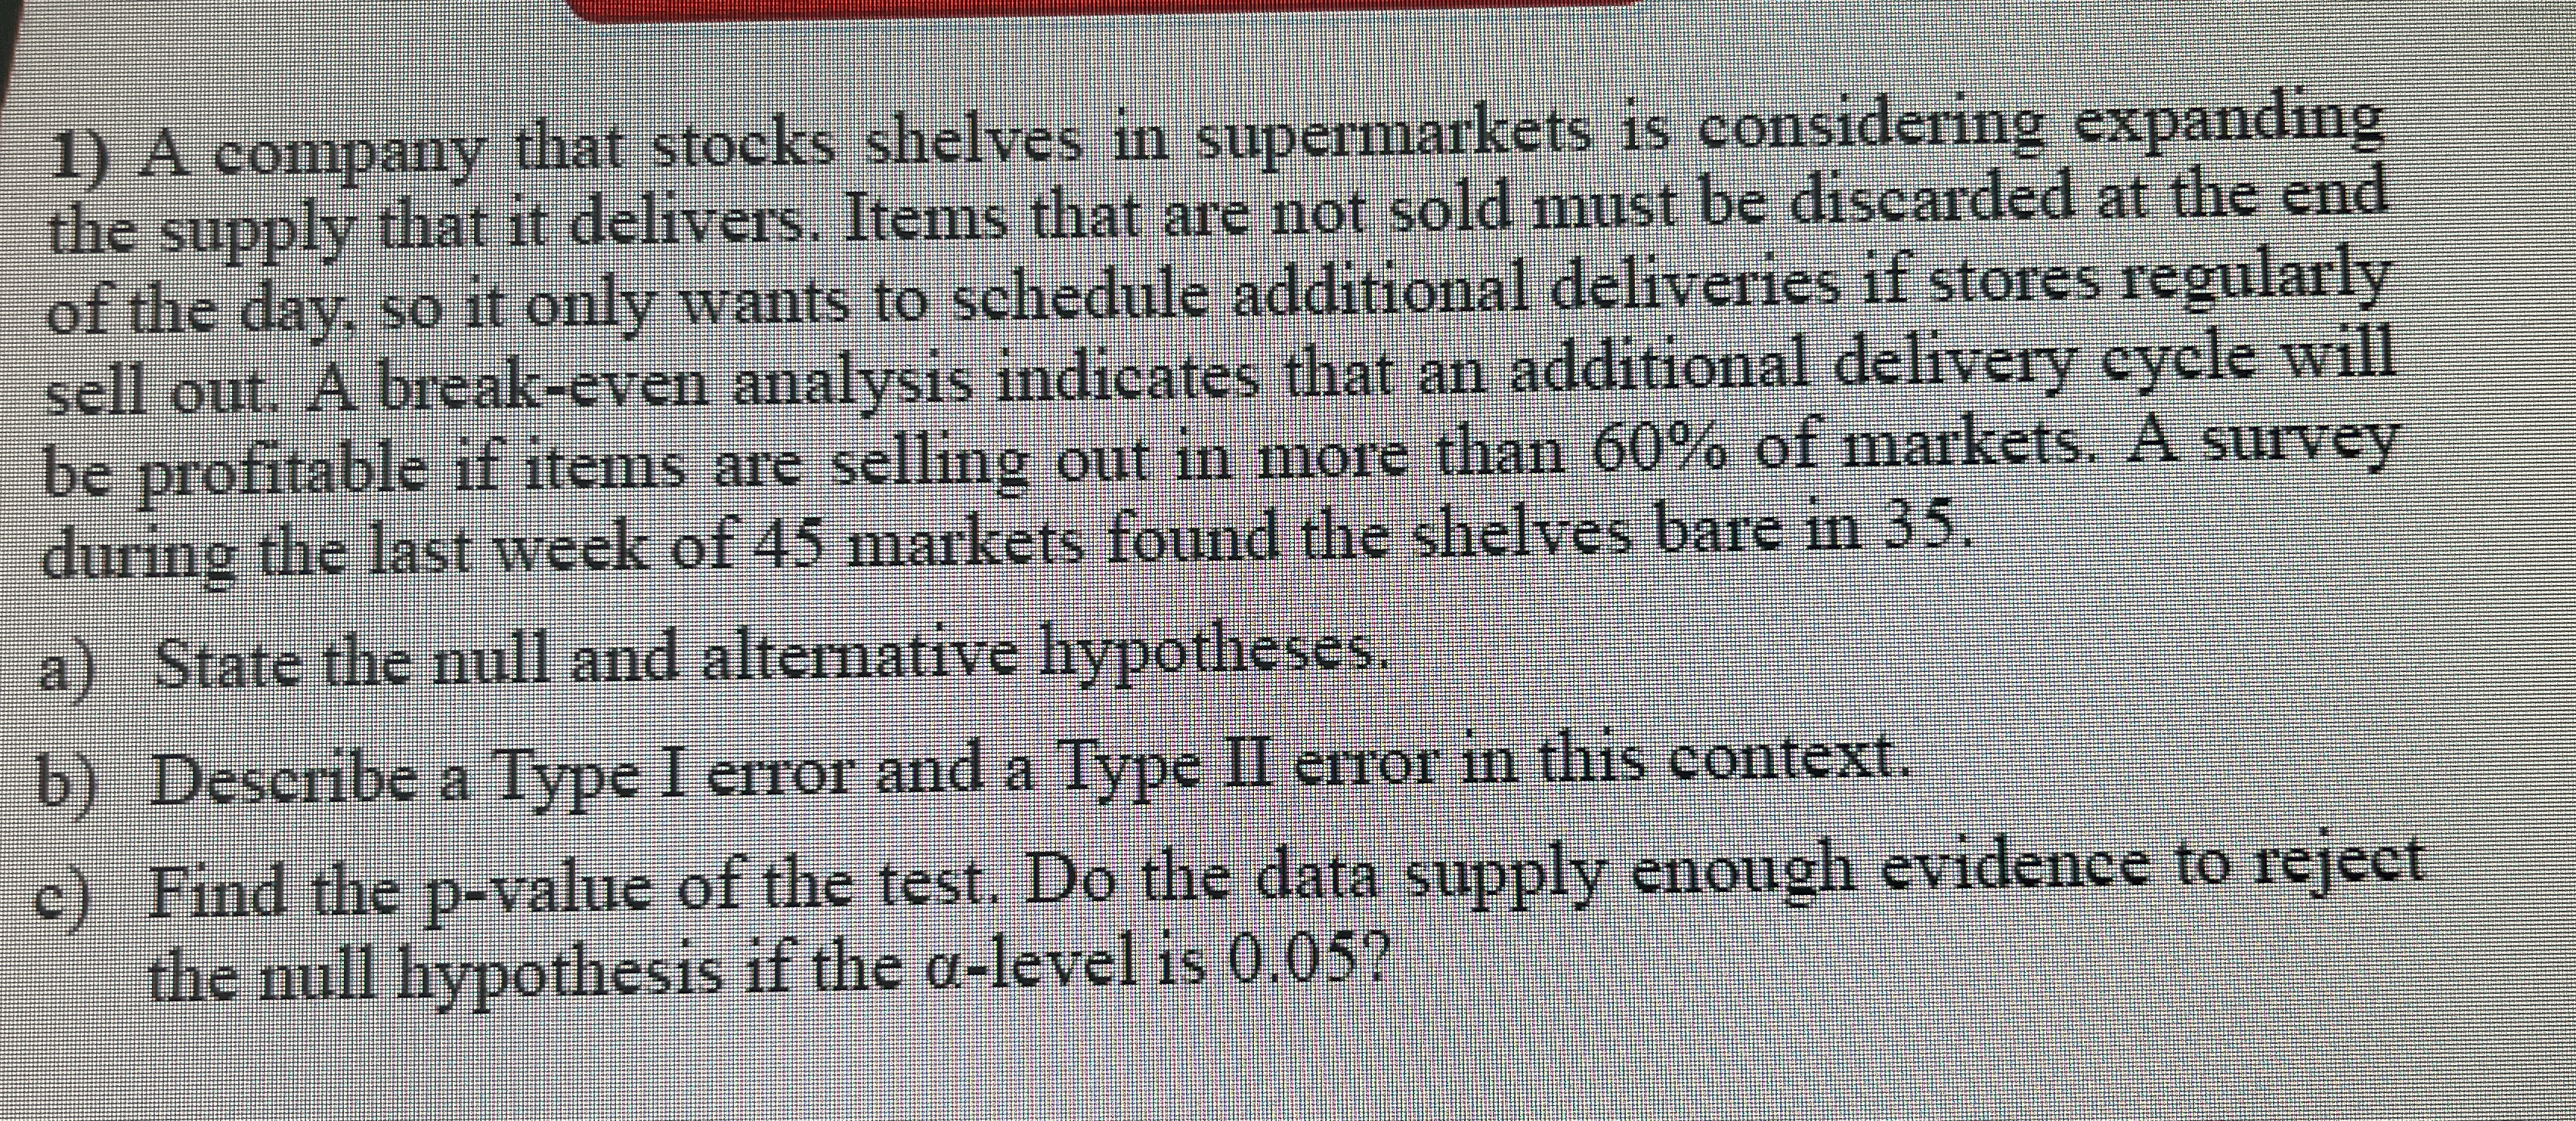
A company that stocks shelves in supermarkets is considering expanding the supply that it delivers. Items that are not sold must be discarded at the end of the day, so it only want... A company that stocks shelves in supermarkets is considering expanding the supply that it delivers. Items that are not sold must be discarded at the end of the day, so it only wants to schedule additional deliveries if stores regularly sell out. A break-even analysis indicates that an additional delivery cycle will be profitable if items are selling out in more than 60% of markets. A survey during the last week of 45 markets found the shelves bare in 35. a) State the null and alternative hypotheses. b) Describe a Type I error and a Type II error in this context. c) Find the p-value of the test. Do the data supply enough evidence to reject the null hypothesis if the α-level is 0.05?
Understand the Problem
The question is asking for the formulation of a statistical hypothesis test. Specifically, it requires stating the null and alternative hypotheses for a scenario involving whether more than 60% of items sell out, explaining the concepts of Type I and Type II errors in this context, and calculating the p-value to determine if there is enough evidence to reject the null hypothesis at a significance level of 0.05.
Answer
$H_0: p \leq 0.60$, $H_a: p > 0.60$. The p-value is approximately $0.0261$.
Answer for screen readers
- $H_0: p \leq 0.60$
- $H_a: p > 0.60$
The p-value is approximately $0.0261$, which indicates that there is enough evidence to reject the null hypothesis at the $\alpha$ level of 0.05.
Steps to Solve
- State the null and alternative hypotheses
The null hypothesis ($H_0$) and alternative hypothesis ($H_a$) can be stated as follows:
- $H_0: p \leq 0.60$ (The proportion of items selling out is less than or equal to 60%)
- $H_a: p > 0.60$ (The proportion of items selling out is greater than 60%)
- Describe Type I and Type II errors
-
Type I Error: This occurs when we reject the null hypothesis when it is actually true. In this context, it means concluding that more than 60% of items sell out when, in reality, they do not.
-
Type II Error: This occurs when we fail to reject the null hypothesis when it is actually false. Here, it means concluding that 60% or less of items sell out when, in reality, they sell out more than 60%.
- Calculate the sample proportion
To calculate the sample proportion ($\hat{p}$):
$$ \hat{p} = \frac{\text{Number of successes}}{\text{Total sample size}} = \frac{35}{45} \approx 0.7778 $$
- Calculate the test statistic
The test statistic for the proportion can be calculated using the formula:
$$ z = \frac{\hat{p} - p_0}{\sqrt{\frac{p_0(1-p_0)}{n}}} $$
where $p_0 = 0.60$ and $n = 45$.
First, we calculate the standard error:
$$ \text{SE} = \sqrt{\frac{0.60 \times (1-0.60)}{45}} \approx 0.0913 $$
Then, the test statistic:
$$ z = \frac{0.7778 - 0.60}{0.0913} \approx 1.944 $$
- Find the p-value
Using a z-table or normal distribution calculator, find the p-value for $z = 1.944$. The p-value for this z-score is approximately $0.0261$.
- Make a decision
Compare the p-value to the significance level ($\alpha = 0.05$):
Since $0.0261 < 0.05$, we reject the null hypothesis.
- $H_0: p \leq 0.60$
- $H_a: p > 0.60$
The p-value is approximately $0.0261$, which indicates that there is enough evidence to reject the null hypothesis at the $\alpha$ level of 0.05.
More Information
In hypothesis testing, a p-value less than the significance level indicates strong evidence against the null hypothesis. A Type I error is declaring more than 60% sell out when it’s not true, while a Type II error is failing to recognize that more than 60% sell out when it actually does.
Tips
- Confusing the hypotheses: Make sure to clearly define the null and alternative hypotheses based on the context of the problem.
- Miscalculating the p-value and test statistic: Always double-check the calculations.
AI-generated content may contain errors. Please verify critical information