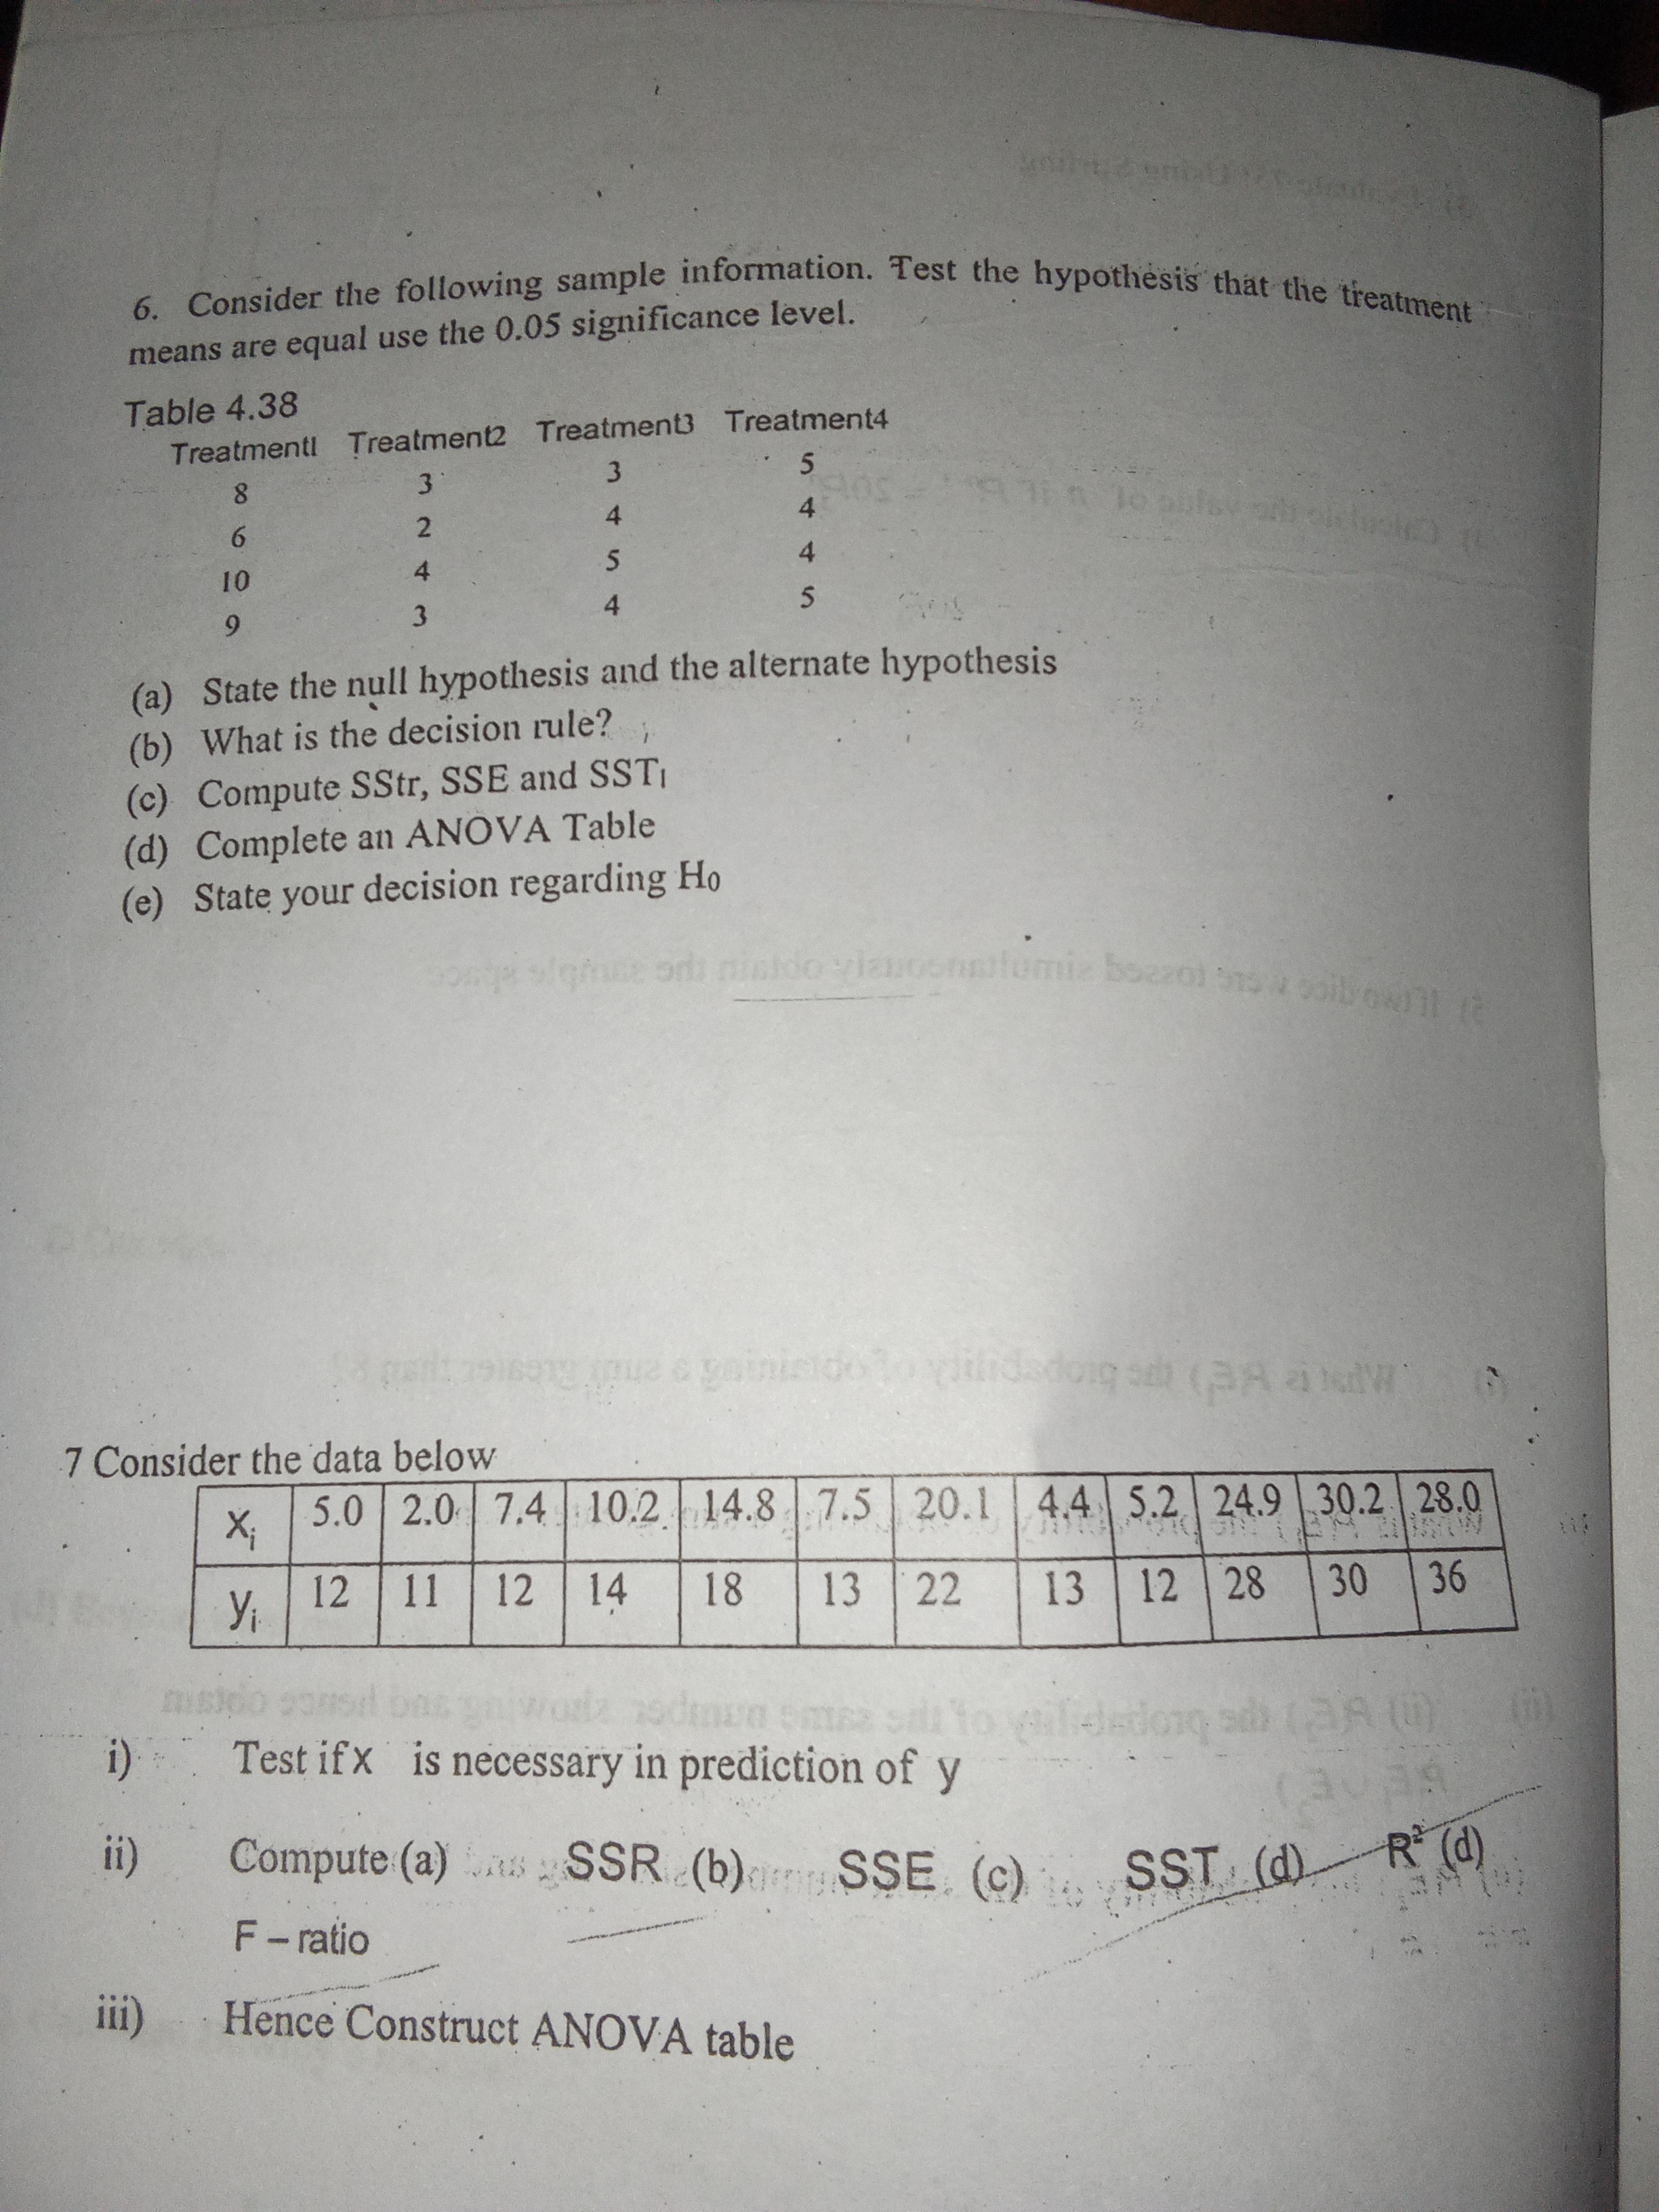
6. Consider the following sample information. Test the hypothesis that the treatment means are equal use the 0.05 significance level. (a) State the null hypothesis and the alternat... 6. Consider the following sample information. Test the hypothesis that the treatment means are equal use the 0.05 significance level. (a) State the null hypothesis and the alternate hypothesis. (b) What is the decision rule? (c) Compute SStr, SSE and SST. (d) Complete an ANOVA Table. (e) State your decision regarding H0. 7. Consider the data below. (i) Test if X is necessary in prediction of Y. (ii) Compute (a) SSR (b) SSE (c) SST (d) F-ratio. (iii) Hence Construct ANOVA table.

Understand the Problem
The question is asking to perform a hypothesis test for the equality of treatment means using a given set of data. It involves identifying null and alternative hypotheses, determining a decision rule, calculating various components (SStr, SSE, SST), completing an ANOVA table, and making a decision regarding the null hypothesis.
Answer
The hypothesis test will be based on the calculated F-statistic compared to the critical value. The conclusion can only be confirmed after performing the specific calculations for the dataset.
Answer for screen readers
The conclusion and correct statistical action depend on the comparisons of calculated and critical F-values, which would need the actual data calculations to finalize.
Steps to Solve
-
State the Hypotheses
- Null hypothesis ($H_0$): The treatment means are equal, i.e., $\mu_1 = \mu_2 = \mu_3 = \mu_4$.
- Alternative hypothesis ($H_a$): At least one treatment mean is different.
-
Determine the Decision Rule
- Using a significance level of 0.05, compare the calculated F value to the critical F value from the F-distribution table with degrees of freedom for the numerator ($df_1$) and denominator ($df_2$).
- The rule is: Reject $H_0$ if $F_{calculated} > F_{critical}$.
-
Calculate SStr, SSE, and SST
- Calculate the overall mean $\bar{Y}$.
- Compute SStr using the formula: $$ SStr = \sum n_i (\bar{Y}_i - \bar{Y})^2 $$
- Compute SSE using the formula: $$ SSE = \sum (Y_{ij} - \bar{Y}_i)^2 $$
- Compute SST using the formula: $$ SST = SStr + SSE $$
-
Complete the ANOVA Table
- The ANOVA table typically contains:
- Source of Variation
- Sum of Squares (SS)
- Degrees of Freedom (df)
- Mean Square (MS)
- F-statistic
- Calculate:
- $df_{treatments} = k - 1$ where $k$ is the number of treatments.
- $df_{error} = N - k$ where $N$ is the total number of observations.
- Mean Square for Treatments ($MS_{treatments} = \frac{SStr}{df_{treatments}}$).
- Mean Square for Error ($MS_{error} = \frac{SSE}{df_{error}}$).
- F-statistic ($F = \frac{MS_{treatments}}{MS_{error}}$).
- The ANOVA table typically contains:
-
Make a Decision Regarding $H_0$
- Compare the calculated F value to the critical F value from the ANOVA table using the degrees of freedom.
- If $F_{calculated} > F_{critical}$, reject $H_0$.
The conclusion and correct statistical action depend on the comparisons of calculated and critical F-values, which would need the actual data calculations to finalize.
More Information
ANOVA (Analysis of Variance) is a statistical method used to compare means across different groups. The null hypothesis typically posits that all group means are equal. The calculations of SStr, SSE, and SST help in determining the variability within and between groups.
Tips
- Forgetting to calculate the means correctly.
- Incorrectly determining degrees of freedom.
- Neglecting to compare the calculated F value with the critical F value.
- Overlooking assumptions of ANOVA, such as normality and homogeneity of variances.
AI-generated content may contain errors. Please verify critical information