Podcast
Questions and Answers
What is the primary purpose of bar graphs?
What is the primary purpose of bar graphs?
Visual representation of data = To make data more complex Comparison of data = To make data more difficult to understand Easy comprehension of data = To make data more complicated Organization of data = To make data more confusing
What does the vertical axis represent in the bar graphs shown in the video?
What does the vertical axis represent in the bar graphs shown in the video?
Different sports = Frequency or number of students Frequency or number of students = Different sports Grade levels = Preferred colors Preferred subjects = Grade levels
What is the range of frequency in the first graph?
What is the range of frequency in the first graph?
0 to 28 = Range of preferred subjects 0 to 7 = Range of preferred colors 0 to 100 = Range of grade levels 0 to 50 = Range of sports
What is the characteristic of the population in the second graph?
What is the characteristic of the population in the second graph?
What is the topic of the second graph in the video?
What is the topic of the second graph in the video?
Flashcards are hidden until you start studying
Study Notes
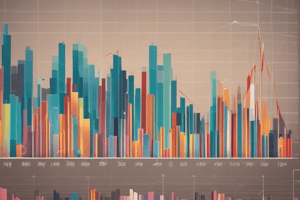
- This video is about bar graphs and how they help in understanding data.
- Bar graphs are a visual representation of data that make it easy to comprehend.
- The example in the video shows the favorite sports of students in different grades.
- The horizontal axis represents the different sports, while the vertical axis represents the frequency or number of students.
- The first graph shows the preferred colors, with a small population and a frequency ranging from 0 to 7.
- The second graph shows the preferred subjects of second-grade students, with a larger population and a frequency ranging from 0 to 28.
Studying That Suits You
Use AI to generate personalized quizzes and flashcards to suit your learning preferences.


