Podcast
Questions and Answers
What is the main difference between a horizontal bar graph and a vertical bar graph?
What is the main difference between a horizontal bar graph and a vertical bar graph?
- The direction of the columns (correct)
- The scale on the axes
- The data represented in each graph
- The type of data being displayed
What type of bar graph would be best for showing the range of temperatures each day in a month?
What type of bar graph would be best for showing the range of temperatures each day in a month?
- Grouped bar graph
- Range bar graph (correct)
- Histogram
- Composite bar graph
What is the primary purpose of a grouped bar graph?
What is the primary purpose of a grouped bar graph?
- To compare multiple sets of data (correct)
- To show the range of data
- To show the frequency of data
- To display numerical data
What type of bar graph would be best for showing the number of students who received each grade on a test?
What type of bar graph would be best for showing the number of students who received each grade on a test?
What is the first step in creating a bar graph?
What is the first step in creating a bar graph?
What is the purpose of creating a bar graph?
What is the purpose of creating a bar graph?
What do the bars in a bar graph represent?
What do the bars in a bar graph represent?
What is the point where the two axes meet called?
What is the point where the two axes meet called?
What determines the style of a bar graph?
What determines the style of a bar graph?
What is another name for a bar graph with columns that extend upward from the x-axis?
What is another name for a bar graph with columns that extend upward from the x-axis?
Flashcards are hidden until you start studying
Study Notes
Bar Graph Definition
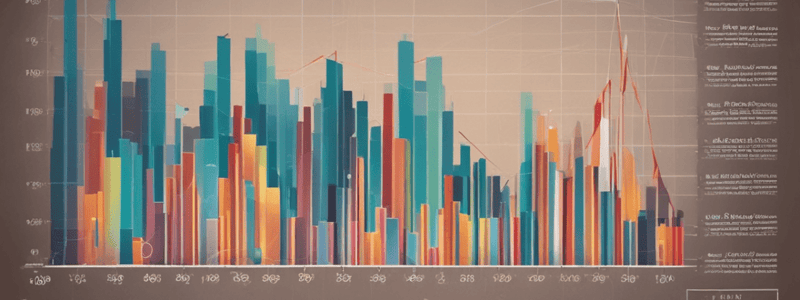
- A bar graph is a visual representation of data, displaying information in a clear way.
- It consists of bars that run either vertically from the x-axis or horizontally from the y-axis, sorted into categories based on the data collected.
- The length of each bar represents a number, and the order of the categories does not matter.
Types of Bar Graphs
- Simple bar graphs:
- Show data in clearly defined categories.
- Examples: vertical bar graphs and horizontal bar graphs.
- Vertical bar graphs:
- Display data in columns that extend upward from the x-axis.
- Very commonly used type of bar graph.
- Horizontal bar graphs:
- Similar to vertical bar graphs, but with categories on the y-axis and columns extending from left to right.
- Scale is displayed on the x-axis.
- Range bar graphs:
- Display data with bars that do not necessarily start at zero, showing a range of data.
- Can be displayed vertically or horizontally.
- Histograms:
- Show numerical data, instead of categories.
- Display data based on frequency, or how often something occurs.
- Bars are often close together without space in between.
- Grouped bar graphs:
- Display multiple sets of data to compare them.
- Bars can be shown in either a vertical or horizontal format.
- Often includes a key describing the colors of the bars.
- Composite bar graphs:
- Show different sets of data on single horizontal or vertical bars.
- Sections of the bars are colored differently to reflect a breakdown of the data.
- A key explains the color-coding system used on the bars.
Using Types of Bar Graphs
- Different types of bar graphs are suitable for different scenarios, such as:
- Basic bar graph for showing grades received by students.
- Range bar graph for tracking sunlight hours over a month.
- Grouped bar graph for comparing sales of different treats on different days.
How to Create a Bar Graph
- Basic steps to create a bar graph:
- Draw the x- and y-axes.
- Decide which axis will display categorical data and which will display numerical data.
- Label each axis.
- Determine the scale and range of the numerical axis and distribute the values along the axis.
- Draw a corresponding bar for each category.
Studying That Suits You
Use AI to generate personalized quizzes and flashcards to suit your learning preferences.


