Podcast
Questions and Answers
Why is establishing a system baseline important immediately after installation?
Why is establishing a system baseline important immediately after installation?
- To ensure compatibility with future hardware upgrades.
- To track the system's performance over time and identify deviations from the norm. (correct)
- To optimize the system for specific applications.
- To reduce the initial storage space used by the operating system.
In Windows Task Manager, how can you identify which applications are consuming the most CPU resources?
In Windows Task Manager, how can you identify which applications are consuming the most CPU resources?
- By analyzing the network utilization in the 'Performance' tab.
- By viewing the 'App history' tab.
- By checking the 'Startup' tab for high-impact applications.
- By sorting the 'CPU' column in the 'Processes' tab. (correct)
When viewing CPU performance in Task Manager, what does the option 'Change graph to > Logical processors' allow you to see?
When viewing CPU performance in Task Manager, what does the option 'Change graph to > Logical processors' allow you to see?
- Only the utilization of the physical CPU.
- A combined utilization graph for all CPU cores.
- Individual utilization graphs for each CPU core or logical processor. (correct)
- A historical view of CPU utilization over the past 24 hours.
What type of disk information can you obtain from the 'Disk' tab within Resource Monitor?
What type of disk information can you obtain from the 'Disk' tab within Resource Monitor?
In Resource Monitor, what does the 'Shareable' column under the 'Memory' tab indicate?
In Resource Monitor, what does the 'Shareable' column under the 'Memory' tab indicate?
How does Performance Monitor differ from Task Manager and Resource Monitor in terms of data collection?
How does Performance Monitor differ from Task Manager and Resource Monitor in terms of data collection?
What information does Reliability Monitor provide about system stability?
What information does Reliability Monitor provide about system stability?
In Reliability Monitor, what do 'critical events' typically indicate?
In Reliability Monitor, what do 'critical events' typically indicate?
Which tool provides the most granular, real-time data about individual processes affecting system performance?
Which tool provides the most granular, real-time data about individual processes affecting system performance?
If a user needs to monitor network activity on a per-process basis, which tool is most suitable?
If a user needs to monitor network activity on a per-process basis, which tool is most suitable?
Which tool would be most appropriate for observing overall CPU utilization without focusing on individual processes?
Which tool would be most appropriate for observing overall CPU utilization without focusing on individual processes?
A system administrator notices a critical error related to a service failure. Which tool would they use to view the history and details of this error?
A system administrator notices a critical error related to a service failure. Which tool would they use to view the history and details of this error?
A technician suspects a specific application is causing excessive disk I/O. Which tool can help identify the application and the specific files it is accessing?
A technician suspects a specific application is causing excessive disk I/O. Which tool can help identify the application and the specific files it is accessing?
What is the quickest way to open Task Manager directly using a keyboard shortcut?
What is the quickest way to open Task Manager directly using a keyboard shortcut?
What type of information displayed in Resource Monitor is not available in Task Manager?
What type of information displayed in Resource Monitor is not available in Task Manager?
Flashcards
Why create a system baseline?
Why create a system baseline?
Aids in troubleshooting by comparing current performance against a known good state.
What is Task Manager?
What is Task Manager?
A Windows tool for monitoring system performance, displaying processes, performance metrics, and resource utilization.
How to sort columns in Task Manager?
How to sort columns in Task Manager?
Sort columns by clicking on them to view ascending or descending values of resource usage.
Tabs in Task Manager's Performance tab?
Tabs in Task Manager's Performance tab?
Signup and view all the flashcards
What is Resource Monitor?
What is Resource Monitor?
Signup and view all the flashcards
Details shown under CPU in Resource Monitor?
Details shown under CPU in Resource Monitor?
Signup and view all the flashcards
Details shown under Network in Resource Monitor?
Details shown under Network in Resource Monitor?
Signup and view all the flashcards
Memory details in Resource Monitor?
Memory details in Resource Monitor?
Signup and view all the flashcards
What is Performance Monitor?
What is Performance Monitor?
Signup and view all the flashcards
What is Reliability Monitor?
What is Reliability Monitor?
Signup and view all the flashcards
Event types in Reliability Monitor?
Event types in Reliability Monitor?
Signup and view all the flashcards
Study Notes
- Monitoring system performance is vital for system administrators
- Monitoring should commence immediately after system installation to establish a baseline for future comparisons
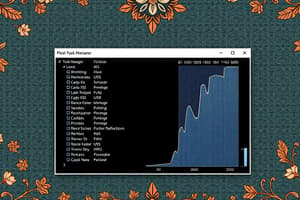
Task Manager
- Accessed via searching "Task Manager" or using the Ctrl+Shift+Esc key combination
- A more detailed view can be accessed by selecting "More details"
- Shows running processes categorized with sortable performance metrics
- Sorting allows identification of highest/lowest consumers of resources like CPU, memory, or disk I/O
- The Performance tab displays graphs for CPU, memory, disk, and network usage
- CPU graph can be configured to display overall utilization or individual cores/logical processors
- Displays total installed RAM and current memory usage
- Shows disk and network utilization
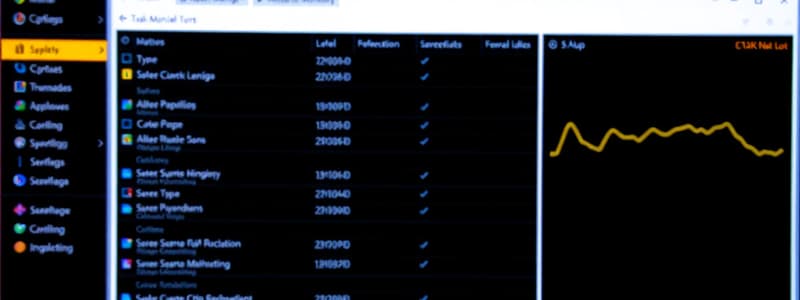
Resource Monitor
- Launched from Task Manager
- Offers more granular information for CPU, Disk, Network, and Memory
- Features overall utilization graphs for each category
- Provides process ID, description, status, and threads utilized per process
- Displays CPU time and average CPU utilization
- Shows processes utilizing disk I/O, filenames, and average bytes per second read/written
- Includes I/O priority and average disk response time
- Shows process name, ID, IP address, and throughput utilized for network connections
- Displays hard faults per second for memory
- Shows amount of virtual memory reserved (Commit) and physical memory in use (Working Set)
- Indicates shareable and non-shareable physical memory amounts
Performance Monitor
- Accessed via Computer Management under Performance > Monitoring Tools
- Requires specifying which counters (data types) to collect data for
- Displays overall system function without per-process information
- Counters can be added to graph overall system performance
Reliability Monitor
- Accessed by searching "reliability"
- Assesses system errors and rates the system on a scale of 1 to 10
- Critical events are marked with a red X, informational events with a blue icon
- Provides details on system incidents, such as application crashes
Studying That Suits You
Use AI to generate personalized quizzes and flashcards to suit your learning preferences.