Podcast
Questions and Answers
What does a correlation coefficient (r) of zero indicate about the relationship between two variables?
What does a correlation coefficient (r) of zero indicate about the relationship between two variables?
- There is a perfect negative correlation between the variables.
- There is a perfect positive correlation between the variables.
- There is a strong positive correlation between the variables.
- There is no association between the variables. (correct)
In a scatterplot, what does a negative correlation suggest about the direction of the relationship between two variables?
In a scatterplot, what does a negative correlation suggest about the direction of the relationship between two variables?
- The changes in the two variables are constant and predictable.
- There is no relationship between the two variables.
- As one variable increases, the other variable also increases.
- As one variable increases, the other variable decreases. (correct)
Which of the following statements best describes a correlation coefficient (r) of +1?
Which of the following statements best describes a correlation coefficient (r) of +1?
- There is a weak positive relationship between the variables.
- There is a moderate negative relationship between the variables.
- There is no relationship between the variables.
- There is a strong positive relationship between the variables. (correct)
When interpreting relationships in a scatterplot, which aspect refers to how closely the points cluster around a line?
When interpreting relationships in a scatterplot, which aspect refers to how closely the points cluster around a line?
What is the implication of a positive association in a correlation?
What is the implication of a positive association in a correlation?
What is the minimum correlation coefficient required for significance with 2 degrees of freedom?
What is the minimum correlation coefficient required for significance with 2 degrees of freedom?
Why is significance more sensitive when dealing with smaller sample sizes?
Why is significance more sensitive when dealing with smaller sample sizes?
In testing for an association between age and personality traits, what indicates a significant result?
In testing for an association between age and personality traits, what indicates a significant result?
What alternative correlation coefficient is derived from ranking data?
What alternative correlation coefficient is derived from ranking data?
Which of the following statements is true regarding the correlation coefficient?
Which of the following statements is true regarding the correlation coefficient?
What is a potential outcome of a small sample size in correlation studies?
What is a potential outcome of a small sample size in correlation studies?
What does a significant correlation imply about the relationship between two variables?
What does a significant correlation imply about the relationship between two variables?
How does the calculation of Spearman’s correlation differ from Pearson’s correlation?
How does the calculation of Spearman’s correlation differ from Pearson’s correlation?
What does a correlation coefficient (r) value of 0.76 indicate about the association between two variables?
What does a correlation coefficient (r) value of 0.76 indicate about the association between two variables?
In the calculation of the correlation coefficient (r), what does covariability represent?
In the calculation of the correlation coefficient (r), what does covariability represent?
When calculating variability for variable X, which formula component is used?
When calculating variability for variable X, which formula component is used?
What does a scatterplot visually represent in relation to two variables?
What does a scatterplot visually represent in relation to two variables?
In the context of null hypothesis significance testing, what does a binary Yes/No answer typically indicate?
In the context of null hypothesis significance testing, what does a binary Yes/No answer typically indicate?
If the sum of products of deviations for both variables is zero, what can be concluded about their correlation coefficient (r)?
If the sum of products of deviations for both variables is zero, what can be concluded about their correlation coefficient (r)?
How does the correlation coefficient change if the sum of squares for one variable becomes very large while the sum of products remains constant?
How does the correlation coefficient change if the sum of squares for one variable becomes very large while the sum of products remains constant?
What implication does a correlation coefficient (r) of 1 have regarding the covariance of two variables?
What implication does a correlation coefficient (r) of 1 have regarding the covariance of two variables?
Study Notes
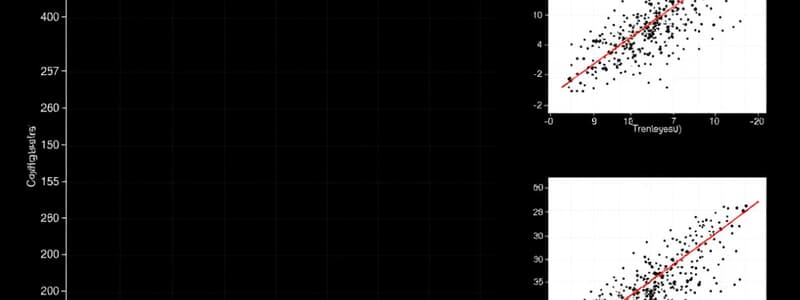
Scatterplots
- Visualize the association between two variables (X and Y)
- Plot pairs of X-Y scores on a graph with X-axis and Y-axis
Correlation
- Quantifies the association between two variables (X, Y)
- Uses a correlation coefficient (r)
- Measures the direction and degree of a linear relationship between variables
- Can be positive, negative, or zero, showing the direction of association
Direction, Degree, and Form of Association
- Direction:
- Positive: Increases in X lead to increases in Y
- Negative: Increases in X lead to decreases in Y
- No relationship: Knowing X provides no information about Y
- Degree:
- Correlation coefficients (r) range from -1 to 1
- r = 1 or -1 indicates a perfect correlation (strongest)
- r = 0 indicates no association (weakest)
- Form:
- Correlation measures the strength of a linear relationship
- Other forms of association (non-linear) may exist
Calculating the Correlation Coefficient (r)
- Covariability of X and Y divided by the variability of X and Y separately:
- Variability is measured using the sum of squares (SS) for each variable
- Covariability is measured using the sum of products (SP)
- r = SP / √(SSx * SSy)
- Represents the degree to which X and Y change together
Null Hypothesis Significance Testing
- Used to determine if an observed correlation is statistically significant
- Examines the probability of obtaining the observed correlation by chance
- Requires a p-value to determine if there is enough evidence to reject the null hypothesis
- Significance depends on the degrees of freedom (df), which is influenced by sample size
- Larger df = larger sample = More robust results
- Smaller df = Smaller sample = Less robust results
Why Significance Depends on Sample Size
- Correlation estimates become more stable as sample size increases
- At smaller sample sizes, large correlations may be due to chance
- A small sample size creates more vulnerability to chance events
Example Correlation Matrix
- Contains correlations between multiple variables, presented in a table
- Shows the strength and direction of relationships between variables
Spearman's Correlation
- Alternative to Pearson's correlation coefficient (r)
- Uses ranks of data points instead of raw scores
- Suitable when data is not normally distributed or when there are outliers
Studying That Suits You
Use AI to generate personalized quizzes and flashcards to suit your learning preferences.
Description
This quiz covers the concepts of correlation and scatterplots in statistics. You will learn how to visualize associations between two variables and calculate the correlation coefficient to measure the relationship's direction and degree. Test your understanding of these fundamental statistical tools.