Podcast
Questions and Answers
What is the primary purpose of using scatterplots in biostatistics?
What is the primary purpose of using scatterplots in biostatistics?
- To evaluate relationships between two quantitative variables (correct)
- To identify outliers in the dataset
- To summarize data with measures of center and spread
- To present categorical data visually
What does the correlation coefficient 'r' indicate in a scatterplot analysis?
What does the correlation coefficient 'r' indicate in a scatterplot analysis?
- The direction and strength of the relationship between two variables (correct)
- The average value of the two variables involved
- The number of data points in the scatterplot
- The presence of outliers in the data
In the context of scatterplots, what does adding categorical variables allow analysts to do?
In the context of scatterplots, what does adding categorical variables allow analysts to do?
- Reduce the complexity of the data being analyzed
- Eliminate the need for correlation analysis
- Compare groups within the bivariate data (correct)
- Focus solely on numerical summaries of data
Which of the following best describes 'bivariate data'?
Which of the following best describes 'bivariate data'?
What does the correlation coefficient measure?
What does the correlation coefficient measure?
In a correlation coefficient of r = -0.75, what does the negative sign indicate?
In a correlation coefficient of r = -0.75, what does the negative sign indicate?
Why is the correlation coefficient considered non-resistant to outliers?
Why is the correlation coefficient considered non-resistant to outliers?
What is the range of values for the correlation coefficient?
What is the range of values for the correlation coefficient?
How is the strength of the correlation characterized?
How is the strength of the correlation characterized?
What does the response variable measure in a study?
What does the response variable measure in a study?
In the context of scatterplots, what is typically plotted on the x-axis?
In the context of scatterplots, what is typically plotted on the x-axis?
Which of the following describes the typical use of a scatterplot?
Which of the following describes the typical use of a scatterplot?
What should be avoided in the scaling of a scatterplot?
What should be avoided in the scaling of a scatterplot?
When interpreting scatterplots, which aspect describes how closely the points fit a specific form?
When interpreting scatterplots, which aspect describes how closely the points fit a specific form?
What type of relationship is indicated by a scatterplot where points trend upwards from left to right?
What type of relationship is indicated by a scatterplot where points trend upwards from left to right?
What does a positive association indicate between two quantitative variables?
What does a positive association indicate between two quantitative variables?
How is an outlier defined in the context of scatterplots?
How is an outlier defined in the context of scatterplots?
What is indicated by a weak or no relationship between two variables?
What is indicated by a weak or no relationship between two variables?
What best describes the strength of the relationship between two variables?
What best describes the strength of the relationship between two variables?
When adding categorical variables to scatterplots, what effect does it have on understanding relationships?
When adding categorical variables to scatterplots, what effect does it have on understanding relationships?
What can be inferred when a scatterplot shows extreme scatter without a clear pattern?
What can be inferred when a scatterplot shows extreme scatter without a clear pattern?
Which scenario best illustrates a negative association between two quantitative variables?
Which scenario best illustrates a negative association between two quantitative variables?
What outcome is typically expected when examining the relationship between incline and energy expended in running speed?
What outcome is typically expected when examining the relationship between incline and energy expended in running speed?
Why is it important to identify outliers in a dataset?
Why is it important to identify outliers in a dataset?
What does positive association typically imply when evaluating two quantitative variables?
What does positive association typically imply when evaluating two quantitative variables?
Flashcards
Bivariate data
Bivariate data
Data that measures two variables for each individual.
Scatterplot
Scatterplot
A graph that shows the relationship between two quantitative variables, with one variable plotted on each axis.
Interpreting a scatterplot
Interpreting a scatterplot
The pattern of a scatterplot, describing if the points trend upward, downward, or have no clear trend. Examining how changes in one variable coincide with changes in the other.
Correlation coefficient (r)
Correlation coefficient (r)
Signup and view all the flashcards
Fact about correlation
Fact about correlation
Signup and view all the flashcards
Explanatory Variable
Explanatory Variable
Signup and view all the flashcards
Response Variable
Response Variable
Signup and view all the flashcards
Interpreting Scatterplots
Interpreting Scatterplots
Signup and view all the flashcards
Data Table
Data Table
Signup and view all the flashcards
Scaling a Scatterplot
Scaling a Scatterplot
Signup and view all the flashcards
Form of the relationship
Form of the relationship
Signup and view all the flashcards
Strength of the relationship
Strength of the relationship
Signup and view all the flashcards
Outlier
Outlier
Signup and view all the flashcards
Positive association
Positive association
Signup and view all the flashcards
Negative association
Negative association
Signup and view all the flashcards
Scatterplot with categorical variables
Scatterplot with categorical variables
Signup and view all the flashcards
Hidden Relationship
Hidden Relationship
Signup and view all the flashcards
r is unitless
r is unitless
Signup and view all the flashcards
Direction of correlation
Direction of correlation
Signup and view all the flashcards
Strength of correlation
Strength of correlation
Signup and view all the flashcards
Correlation is not resistant
Correlation is not resistant
Signup and view all the flashcards
Study Notes
Biostatistics & Statistical Analysis - Chapter 3
- Chapter 3 focuses on relationships using scatterplots and correlation.
- Previous Learning Objectives covered describing distributions using numbers:
- Measures of center (mean and median)
- Measures of spread (quartiles and standard deviation)
- Five-number summary and boxplots
- Interquartile range (IQR) and outliers
- Dealing with outliers
- Choosing among summary statistics
- Organizing statistical problems
Learning Objectives
- Demonstrate relationships using scatterplots and correlation
- Understand bivariate data
- Create scatterplots
- Interpret scatterplots
- Add categorical variables to scatterplots
- Define the correlation coefficient (r)
- Understand facts about correlation
Bivariate Data
- For each individual, data is recorded on two variables.
- Examine relationships between variables.
- Changes in one variable often correlate with changes in another.
- Example: Number of beers consumed and resulting blood alcohol content (BAC) for 16 students.
Scatterplots
- Used to display quantitative bivariate data.
- Each variable maps to an axis.
- Each individual is represented as a point on the plot.
Explanatory and Response Variables
- A response (dependent) variable measures the outcome of a study.
- An explanatory (independent) variable influences the response variable
- In a scatterplot, explanatory variable is typically plotted on the x-axis.
- Example: Number of beers is the explanatory variable (independent variable) and BAC is the response variable (dependent variable)
Scaling a Scatterplot
- Data is often displayed similarly across different plots.
- Both variables should occupy a similar amount of space.
- The plot should be roughly square, points ideally filling the plot space without blank areas.
Interpreting Scatterplots
- Describe the overall relationship pattern.
- Look for:
- Form (linear, curved, clusters, no pattern)
- Direction (positive, negative, no direction)
- Strength (how closely points fit the form and deviations from it)
- Outliers (points that deviate significantly from the pattern).
Types of Relationships
- Linear Relationship: The points show a linear pattern.
- No Relationship: The points show little or no connection.
- Nonlinear Relationship: A pattern not represented by a straight line.
- Positive Association: Higher values of one variable tend to occur with higher values in the other variable.
- Negative Association: Higher values of one variable tend to occur with lower values in the other variable.
Outliers in Scatterplots
- An outlier is unusual or unexpected data point, with a low probability of occurrence.
- Outliers in a scatterplot appear outside the overall pattern of the relationship.
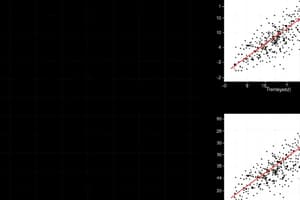
Adding Categorical Variables to Scatterplots
- Compare two or more relationships on a single plot by using different symbols for groups of points.
- Example: compare thorax length and longevity for male fruit flies that either reproduce or do not reproduce.
The Correlation Coefficient (r)
- A measure of the direction and strength of the relationship between two variables.
- Calculated using the means and standard deviations of both variables
- r = 1 or r =−1 represents a perfect linear relationship
- r = 0 represents no linear relationship.
The Roles of the Variables in r
- r treats both variables symmetrically (x and y)
- One variable can be explanatory for the other, typically put on the x-axis.
- The correlation (r) is the same regardless.
r has no units
- r isn't influenced by the units of measurement of the variables.
- It's a standardized measure.
Correlation and Strength/Direction
- Strength is indicated by the absolute value of r.
- Direction is indicated by the sign of r (positive or negative).
- Range of r: -1 to 1
r is Not Resistant to Outliers
- Correlations are based on means & standard deviations, making them sensitive to outliers.
- Outliers can influence the correlation value.
- In this case, moving a point can reduce the correlation strength.
Software: SPSS
- Software for statistical analysis
- Student discount and regular pricing information available online for the appropriate software.
Variance
- Another measure of data spread.
- Mean sum of squares.
- Population vs sample variance formulas.
- Standard deviation is the positive square root of variance.
Application of SPSS
- A variety of tools, analyses and reporting options.
- Data entry, manipulation, and descriptive analyses.
Studying That Suits You
Use AI to generate personalized quizzes and flashcards to suit your learning preferences.