Podcast
Questions and Answers
What is the range of values for a correlation coefficient?
What is the range of values for a correlation coefficient?
- -1 to 1 (correct)
- 0 to 10
- -10 to 10
- 0 to 1
What type of statistic is a correlation coefficient when it summarizes the relationship between two variables?
What type of statistic is a correlation coefficient when it summarizes the relationship between two variables?
- Descriptive statistic
- Inferential statistic
- Multivariate statistic
- Bivariate statistic (correct)
What is the purpose of using an F test or a t test with a correlation coefficient?
What is the purpose of using an F test or a t test with a correlation coefficient?
- To determine the direction of the relationship
- To summarize the sample data
- To calculate the practical significance of the result
- To generalize the results to the population (correct)
What is a benefit of using correlation coefficients to compare results between studies?
What is a benefit of using correlation coefficients to compare results between studies?
What does a correlation coefficient not allow you to do?
What does a correlation coefficient not allow you to do?
What is the primary goal of calculating a correlation coefficient?
What is the primary goal of calculating a correlation coefficient?
In a scatterplot, what does a linear pattern indicate?
In a scatterplot, what does a linear pattern indicate?
What does the sign of the correlation coefficient indicate?
What does the sign of the correlation coefficient indicate?
What is the range of the correlation coefficient?
What is the range of the correlation coefficient?
What is the purpose of visually inspecting the scatterplot?
What is the purpose of visually inspecting the scatterplot?
Study Notes
Correlation Coefficient
- A correlation coefficient is a number between -1 and 1 that measures the strength and direction of a relationship between variables.
- It reflects how similar the measurements of two or more variables are across a dataset.
What does a Correlation Coefficient Tell You?
- Correlation coefficients summarize data and help compare results between studies.
- They are descriptive statistics, meaning they summarize sample data without inferring anything about the population.
- Correlation coefficients are bivariate statistics when summarizing the relationship between two variables, and multivariate statistics when dealing with more than two variables.
Comparing Studies
- Correlation coefficients are effect size measures, telling you the practical significance of a result.
- They are unit-free, making it possible to directly compare coefficients between studies.
Correlational Research Example
- Investigating the relationship between standardized scores from high school and academic grades in college.
- Predicting a positive correlation: higher NSAT scores are associated with higher college GPAs, while lower NSAT scores are associated with lower college GPAs.
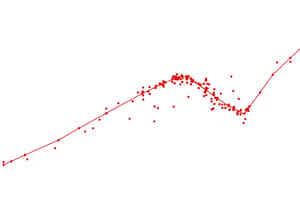
Visualizing Data
- Scatterplots can be used to visualize data, plotting one variable on the x-axis and the other on the y-axis.
- Visual inspection can help identify a linear or non-linear pattern between variables.
Calculating a Correlation Coefficient
- There are many different correlation coefficients that can be calculated, such as Pearson's r.
- Select a correlation coefficient based on the general shape of the scatter plot pattern.
- Perform a correlation analysis to find the correlation coefficient for your data.
Interpreting a Correlation Coefficient
- The value of the correlation coefficient always ranges between -1 and 1.
- The sign of the coefficient reflects whether the variables change in the same or opposite directions.
- The absolute value of the correlation coefficient tells you the magnitude of the correlation: the greater the absolute value, the stronger the correlation.
- Guidelines for interpreting correlation coefficients can vary between study fields, but a general guideline is:
- 0.00 to 0.19: very weak correlation
- 0.20 to 0.39: weak correlation
- 0.40 to 0.59: moderate correlation
- 0.60 to 0.79: strong correlation
- 0.80 to 1.00: very strong correlation
Studying That Suits You
Use AI to generate personalized quizzes and flashcards to suit your learning preferences.
Description
Understand the correlation coefficient, its formulas, and examples. Learn how it measures the strength and direction of relationships between variables and summarizes data.