Podcast
Questions and Answers
Which of the following statements accurately describes the trend line in a scatter plot exhibiting a positive correlation?
Which of the following statements accurately describes the trend line in a scatter plot exhibiting a positive correlation?
- It is slanting down to the right.
- It is horizontal, showing no distinct direction.
- It is slanting up to the right. (correct)
- It forms a curve rather than a straight line.
If a scatter plot shows high values of one variable associated with low values of another and vice versa, which type of correlation is most likely present?
If a scatter plot shows high values of one variable associated with low values of another and vice versa, which type of correlation is most likely present?
- Zero correlation
- Perfect correlation
- Negative correlation (correct)
- Positive correlation
In a scenario where there is absolutely no discernible relationship between two variables, how would a scatter plot typically appear?
In a scenario where there is absolutely no discernible relationship between two variables, how would a scatter plot typically appear?
- The scatter plot does not follow any trend line. (correct)
- The points form a clear diagonal line slanting upwards.
- The points on the scatter plot follow a distinct curve.
- All points cluster closely around a straight line.
Which of the following correlation coefficient (r) values indicates the strongest negative linear relationship between two variables?
Which of the following correlation coefficient (r) values indicates the strongest negative linear relationship between two variables?
What does a correlation coefficient (r) value of 0 imply regarding the relationship between two variables?
What does a correlation coefficient (r) value of 0 imply regarding the relationship between two variables?
Which of the following best describes the purpose of regression analysis?
Which of the following best describes the purpose of regression analysis?
In the context of regression analysis, what is the 'dependent variable' also known as?
In the context of regression analysis, what is the 'dependent variable' also known as?
What does the y-intercept of a regression equation represent?
What does the y-intercept of a regression equation represent?
What is the key characteristic of a discrete random variable?
What is the key characteristic of a discrete random variable?
Which of the following is a property of a normal distribution?
Which of the following is a property of a normal distribution?
Who first developed the mathematical equation for the normal curve?
Who first developed the mathematical equation for the normal curve?
What is the purpose of converting X-scale to the z-scale in statistics?
What is the purpose of converting X-scale to the z-scale in statistics?
Which of the following is considered a Bivariate Data?
Which of the following is considered a Bivariate Data?
Which of the following describes the process of determining whether there exists a relationship between two variables?
Which of the following describes the process of determining whether there exists a relationship between two variables?
What is another term used for the Dependent Variable (y) in Regression Analysis?
What is another term used for the Dependent Variable (y) in Regression Analysis?
If given the Z-score Formula, $Z = \frac{X - \mu}{\sigma}$, what is the next step to get the formula for $\sigma$?
If given the Z-score Formula, $Z = \frac{X - \mu}{\sigma}$, what is the next step to get the formula for $\sigma$?
In the context of correlation, what does 'perfect' correlation imply?
In the context of correlation, what does 'perfect' correlation imply?
What happens to the other variable when one variable decreases in a negative correlation?
What happens to the other variable when one variable decreases in a negative correlation?
How is normal distribution used?
How is normal distribution used?
What comprises probability distribution?
What comprises probability distribution?
Flashcards
Univariate Data
Univariate Data
Data that involves a single variable only.
Bivariate Data
Bivariate Data
Data that involves two variables.
Correlation Analysis
Correlation Analysis
The process of describing the relationship between two variables.
Scatter Plot
Scatter Plot
Signup and view all the flashcards
Trend Line (Line of Best Fit)
Trend Line (Line of Best Fit)
Signup and view all the flashcards
Positive Correlation
Positive Correlation
Signup and view all the flashcards
Negative Correlation
Negative Correlation
Signup and view all the flashcards
Zero/No Correlation
Zero/No Correlation
Signup and view all the flashcards
Perfect Correlation
Perfect Correlation
Signup and view all the flashcards
Correlation Coefficient (r)
Correlation Coefficient (r)
Signup and view all the flashcards
Regression Analysis
Regression Analysis
Signup and view all the flashcards
Simple Linear Regression Analysis
Simple Linear Regression Analysis
Signup and view all the flashcards
Regression Line
Regression Line
Signup and view all the flashcards
Regression Equation
Regression Equation
Signup and view all the flashcards
Probability Distribution
Probability Distribution
Signup and view all the flashcards
Probability Density Function
Probability Density Function
Signup and view all the flashcards
Gaussian Distribution
Gaussian Distribution
Signup and view all the flashcards
Standardizing a Normal Probability Distribution
Standardizing a Normal Probability Distribution
Signup and view all the flashcards
Curve of a Continuous Random Variable
Curve of a Continuous Random Variable
Signup and view all the flashcards
Study Notes
- Study notes for Statistics and Probability
Describing Relationships Using Scatter Plot
- Univariate data involves a single variable.
- Bivariate data involves two variables.
- Correlation analysis describes the relationship between two variables, using a statistical method to determine if a relationship exists.
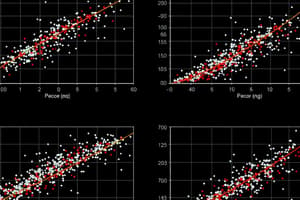
- A scatter plot graphically represents the relationship between two variables, using ordered pairs to determine if a relationship exists.
- A trend line (or line of best fit) goes through a scatter plot's data points and expresses the relationship between the points which are closest to said trend line.
Correlation Description
- Correlation can be described by strength (perfect, high, moderately high/low, low, or zero/no) and direction (positive, negative, or zero/no).
Types of Correlation According to Direction
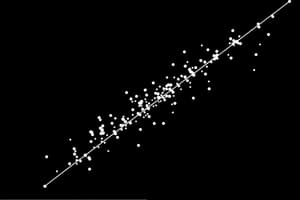
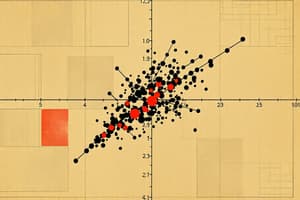
- Positive correlation exists if high values in one variable are associated with high values in another variable, and low values are associated with low values.
- With positive correlation, as one variable increases, the other increases, and the trend line slants up to the right.
- Negative correlation exists if high values in one variable are associated with low values in another variable, and low values are associated with high values.
- With negative correlation, as one variable increases, the other decreases, and the trend line slants down to the right.
- Zero/no correlation exists if high values in one variable are associated with high or low values in the other variable, showing no relationship and no trend line.
Types of Correlation According to Strength
- Perfect correlation exists when all points on the scatter plot lie on a straight line which is a controlled variable.
- If the points on a scatter plot don't follow a straight line, the relationship may be very high, high, moderately high, low, negligible, or zero.
- Further categorizations include perfect positive, high positive, moderately high positive/negative, high negative, and perfect negative correlations.
Exploring the Pearson Product-Moment Correlation
- Correlation coefficient (r) describes the strength and direction of the relationship between two variables, ranging from -1 to +1.
- r = 1 means perfect positive relationship, r = -1 means perfect negative relationship, r = 0 means no relationship.
Values of r and their interpretations
- -1: Perfect Negative Correlation
- 1: Perfect Positive Correlation
- 0: No Correlation
- 0.80 to 0.99: Very High Positive Correlation
- 0.60 to 0.79: High Positive Correlation
- 0.40 to 0.59: Moderately Positive Correlation
- 0.20 to 0.39: Low Positive Correlation
- 0.01 to 0.19: Negligible Positive Correlation
- -0.01 to -0.19: Negligible Negative Correlation
- -0.20 to -0.39: Low Negative Correlation
- -0.40 to -0.59: Moderately Negative Correlation
- -0.69 to -0.79: High Negative Correlation
- -0.80 to -0.99: Very High Negative Correlation
Exploring Regression Analysis
- Regression analysis predicts the value of one variable based on another.
- Simple linear regression deals with one dependent and one independent variable.
- Multiple linear regression deals with more than one independent variable.
Components of a Regression Analysis
- Dependent variable (y) is the "response variable."
- Independent variable (x) is the "predictor variable" or "explanatory variable."
- A regression line is a straight line that best fits a set of data points.
- A regression equation is the equation of the regression line.
- The Y-intercept of the Regression Equation is the predicted value of the dependent variable when the independent variable is zero.
- Predicting one variable requires getting the regression equation, represented graphically as a line, assuming a linear relationship.
- The formula for this is shown as Y’ = b0X + b1
- Where
- Y’: predicted value
- X: value of the independent variable
- b0: slope of the regression line
- b1: y-intercept of the regression line
- Find the slope of the line with: b0= 𝑛∑𝑋𝑌 − ∑𝑋∑ / 𝑛∑𝑋² − (∑𝑋)²
- Find the y-intercept of the line with: b1= ∑𝑌 − 𝑏 0 ∑𝑋 / 𝑛
Normal Probability Distribution
- Probability distribution assigns probabilities to the values of a random variable and is equal to the area under the curve.
- Discrete random variable has a countable set of possible outcomes.
- Continuous random variable takes on values from within an interval, or disjoint union of intervals.
- Probability density function is a frequency function or a probability distribution.
- The curve of a continuous random variable is the function of X denoted by f(X).
- The mathematical equation of the normal distribution is 𝑓(𝑥) = 1 /σ 2π * 𝑒 −2(𝑋−µ/σ)^2
Normal Distribution Aspects
- μ = mean
- σ = standard deviation
- Raw Score that Corresponds to each Z-score Value is X = μ ± 𝑧σ
Normal Distribution
- The normal distribution is a "bell curve" or "Gaussian Distribution" (developed by Carl Friedrich Gauss).
- It calculates probabilities concerning a population.
- Abraham de Moivre developed the mathematical equation for the normal curve.
- Properties of the normal distribution include being bell-shaped, symmetric, having mean = median = mode, having tail ends asymptotic to the base line, a shape dependent upon the mean and standard deviation, and a total area of 1 or 100% (50% less/greater than the mean).
Standardizing a Normal Probability Distribution
- Standardizing involves converting the X-scale to the z-scale
- This follows the formula: 𝑧 = 𝑥−µ / σ
- Where X = value of the variable
Studying That Suits You
Use AI to generate personalized quizzes and flashcards to suit your learning preferences.