Podcast
Questions and Answers
Een __________ is een verzameling van alle gegevens uit een statistisch onderzoek.
Een __________ is een verzameling van alle gegevens uit een statistisch onderzoek.
dataset
Een klasse is een interval waarin geen gegevens gegroepeerd worden.
Een klasse is een interval waarin geen gegevens gegroepeerd worden.
False (B)
Wat beschrijft het beste de term 'uitschieter'?
Wat beschrijft het beste de term 'uitschieter'?
- Een getal dat veel kleiner of veel groter is dan de overige getallen. (correct)
- Het meest voorkomende getal in de dataset.
- Een getal dat ongeveer gelijk is aan de meeste andere getallen in de dataset.
- Het gemiddelde van alle getallen in de dataset.
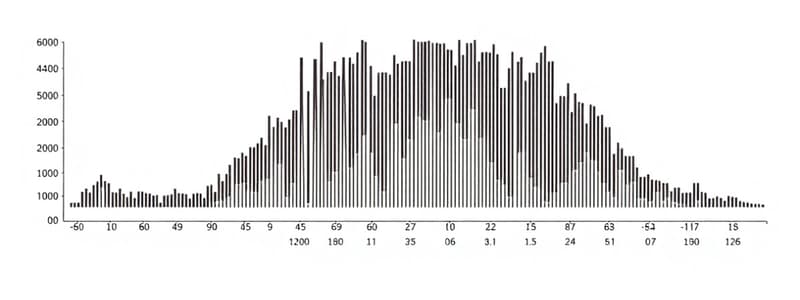
Een __________ is een grafische weergave van de frequentieverdeling van in klassen gegroepeerde data.
Een __________ is een grafische weergave van de frequentieverdeling van in klassen gegroepeerde data.
Wat is de functie van een 'cluster' in data?
Wat is de functie van een 'cluster' in data?
In de context van beschrijvende statistiek, wat is het belang van een dataset?
In de context van beschrijvende statistiek, wat is het belang van een dataset?
Een frequentieverdeling wordt gevormd door ongegroepeerde gegevens.
Een frequentieverdeling wordt gevormd door ongegroepeerde gegevens.
Combineer de volgende termen met hun juiste omschrijving:
Combineer de volgende termen met hun juiste omschrijving:
Welke van de volgende opties helpt bij het identificeren van patronen binnen datasets?
Welke van de volgende opties helpt bij het identificeren van patronen binnen datasets?
Hoe kunnen staafdiagrammen gebruikt worden bij beschrijvende statistiek?
Hoe kunnen staafdiagrammen gebruikt worden bij beschrijvende statistiek?
Flashcards
Dataset
Dataset
A collection of all data from a statistical investigation.
Class
Class
An interval in which data is grouped. All grouped data together form the frequency distribution.
Outlier
Outlier
A number that is much smaller or larger than the other numbers.
Histogram
Histogram
Signup and view all the flashcards
Cluster
Cluster
Signup and view all the flashcards
Study Notes
- A dataset is a collection of all data from a statistical study.
- A class is an interval in which data is grouped.
- All grouped data together form the frequency distribution.
- An outlier is a number that is much smaller or larger than the other numbers.
- A histogram is a graphical representation of the frequency distribution of data grouped into classes.
- A cluster is a part of the data that has one or more common characteristics.
Studying That Suits You
Use AI to generate personalized quizzes and flashcards to suit your learning preferences.