Podcast
Questions and Answers
What does the scale of a map indicate?
What does the scale of a map indicate?
- The geographical location of a specific area.
- The relationship between real-world distances and their representation on the map. (correct)
- The distance between two points on the map.
- The symbols used to represent different features on the map.
Which of these is a typical way to express the scale of a map?
Which of these is a typical way to express the scale of a map?
- Number of symbols per square kilometer
- Inches per kilometer
- Representative fraction (e.g., 1/50,000) (correct)
- Degrees of latitude
A larger representative fraction, such as 1/250,000 compared to 1/50,000, indicates that the map is:
A larger representative fraction, such as 1/250,000 compared to 1/50,000, indicates that the map is:
- Smaller in scale and shows less detail. (correct)
- Smaller in scale and shows more detail.
- Larger in scale and shows more detail.
- Larger in scale and shows less detail.
What is the primary difference between a large-scale map and a small-scale map?
What is the primary difference between a large-scale map and a small-scale map?
What is an 'antipocentric' map?
What is an 'antipocentric' map?
What is the purpose of a compass rose on a map?
What is the purpose of a compass rose on a map?
What are the advantages of having a map with a 'north arrow'?
What are the advantages of having a map with a 'north arrow'?
Why is the central position of an ocean on a map important?
Why is the central position of an ocean on a map important?
What is a key consideration when analyzing maps, according to the text?
What is a key consideration when analyzing maps, according to the text?
What is the main argument about map projections?
What is the main argument about map projections?
What does a dot map demonstrate?
What does a dot map demonstrate?
Which map type uses colors to connect locations with equal data values?
Which map type uses colors to connect locations with equal data values?
Which example is NOT mentioned as a potential use for a cartogram?
Which example is NOT mentioned as a potential use for a cartogram?
What does the text suggest about the relationship between maps and reality?
What does the text suggest about the relationship between maps and reality?
How are GIS systems (Geographic Information Systems) used to create maps?
How are GIS systems (Geographic Information Systems) used to create maps?
What is the main focus of the text?
What is the main focus of the text?
Maps are not natural, so they are made by people. What does this statement mean?
Maps are not natural, so they are made by people. What does this statement mean?
Based on the presented ideas, what is the primary reason maps are considered 'partial, incomplete, and political'?
Based on the presented ideas, what is the primary reason maps are considered 'partial, incomplete, and political'?
What is the difference between the 'limits of our current knowledge' and the 'agendas, interests, and biases' discussed in relation to maps?
What is the difference between the 'limits of our current knowledge' and the 'agendas, interests, and biases' discussed in relation to maps?
What is an example of how maps can be used as 'statements of power and authority'?
What is an example of how maps can be used as 'statements of power and authority'?
Why is critical thinking important when analyzing maps?
Why is critical thinking important when analyzing maps?
What is the core idea behind the statement "Every map focuses on some things and leaves other things out"?
What is the core idea behind the statement "Every map focuses on some things and leaves other things out"?
The text refers to maps as an 'abstraction of a complex reality', what does this mean in the context of maps?
The text refers to maps as an 'abstraction of a complex reality', what does this mean in the context of maps?
What is the key importance of understanding map projections?
What is the key importance of understanding map projections?
Flashcards
Map Perspective
Map Perspective
Different viewpoints influencing map orientation, e.g., Atlantic vs. Pacific-centric.
Map Projection
Map Projection
The method of representing the 3-D Earth on 2-D maps; involves distortions.
GIS
GIS
Geographic Information Science; analyzes and visualizes spatial data layers.
Dot Maps
Dot Maps
Signup and view all the flashcards
Choropleth Maps
Choropleth Maps
Signup and view all the flashcards
Isopleth Maps
Isopleth Maps
Signup and view all the flashcards
Cartograms
Cartograms
Signup and view all the flashcards
Types of Maps
Types of Maps
Signup and view all the flashcards
Scale
Scale
Signup and view all the flashcards
Large scale map
Large scale map
Signup and view all the flashcards
Small scale map
Small scale map
Signup and view all the flashcards
Representative fraction
Representative fraction
Signup and view all the flashcards
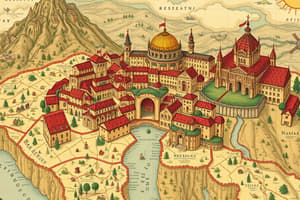
Perspective in maps
Perspective in maps
Signup and view all the flashcards
Antipocentric map
Antipocentric map
Signup and view all the flashcards
North arrow
North arrow
Signup and view all the flashcards
Compass rose
Compass rose
Signup and view all the flashcards
What is a map?
What is a map?
Signup and view all the flashcards
Abstraction in maps
Abstraction in maps
Signup and view all the flashcards
Maps are political and cultural
Maps are political and cultural
Signup and view all the flashcards
Thinking critically about maps
Thinking critically about maps
Signup and view all the flashcards
Scale in maps
Scale in maps
Signup and view all the flashcards
Map types
Map types
Signup and view all the flashcards
Partiality of maps
Partiality of maps
Signup and view all the flashcards
Study Notes
Introduction to Human Geography and Environment & Society
- Course unit 1 introduces human geography and environment & society
- Readings from Chapter 1 (pages 22-36), section 1.4
- The unit includes an overview, key concepts in human geography I & II, and the map
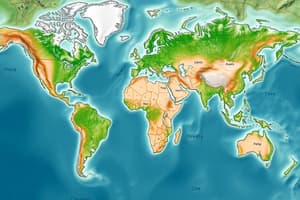
- A map is a two-dimensional graphical representation of the world
- It is a tool for both communication and spatial problem analysis
What are Maps?
- Maps are a critical tool requiring thoughtful consideration
- Maps are created by people and reflect inherent biases from the viewpoint of the creator
- They reflect agendas, interests, and biases of the people who made them
- Essential because they are abstractions of complex reality
- They simplify and represent reality in a scaled-down version
- Maps are partial, incomplete, and political
- Maps choices simplify to the significant aspects of the world for that purpose
Key Considerations for Producing and Understanding Maps
- Scale: Shows the relationship between reality and the map's representation. A smaller scale represents a larger area.
- Scales are typically presented as a ratio (e.g., 1:50,000) or a representative fraction (e.g., 1/50,000).
- Perspective: How a map is oriented, including the use of a north arrow or a compass rose.
- Maps' perspectives can be political and cultural, reflecting biases of the creator and intended audience. For example, an 'antipocentric' map positions the South to be central
- Projection: Methods of representing a three-dimensional sphere (Earth) on a two-dimensional map. Distortion is inherent due to this
- Tools: Modern-day mapmaking uses Geographic Information Systems (GIS) to analyze data and display complex information.
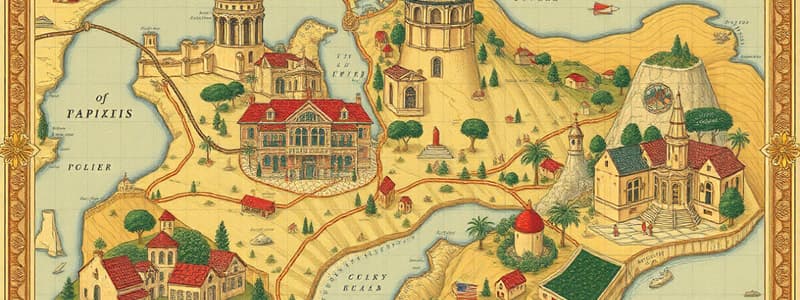
Map Types
- Dot Maps: show spatial concentrations or dispersions of a feature—e.g., the density, origins, or diffusion of a disease.
- Choropleth Maps: use color shading to communicate information—e.g. population density, growth/decline, aging.
- Isopleth Maps: connect locations of equal data value using color.
- Show areas of equal rainfall, temperature, or frost zones.
- Cartograms: distort space to emphasize certain attributes, such as electoral outcomes or population sizes.
Wrapping Up
- Critical ways of reading and producing maps are essential:
- Maps are abstractions of reality
- They are used as cultural and political documents.
- Maps are gateways to understanding history, power, human knowledge
- Maps need to be considered in terms of scale, perspective, projections, tools and map types
- The next class will cover Cultural geography (Chapter 6, sections 6.1, 6.2, 6.4)
Studying That Suits You
Use AI to generate personalized quizzes and flashcards to suit your learning preferences.