Podcast
Questions and Answers
What is the purpose of choosing an appropriate title for a graph?
What is the purpose of choosing an appropriate title for a graph?
- To confuse viewers about the data being represented
- To hide the relationship between the variables
- To make the graph aesthetically pleasing
- To ensure others can understand the data displayed and conclusions that can be drawn (correct)
In a graph plotting fuel consumption against the number of miles driven, which variable would typically be represented on the x-axis?
In a graph plotting fuel consumption against the number of miles driven, which variable would typically be represented on the x-axis?
- Fuel consumption per mile
- Amount of fuel in the tank
- The type of fuel used
- Number of miles driven (correct)
What is the role of the y-axis in a graph?
What is the role of the y-axis in a graph?
- It determines the scale for the x-axis
- It ensures that the graph looks balanced
- It helps show trends or correlations in the data (correct)
- It represents the independent variable
Why is it crucial to label both axes correctly on a graph?
Why is it crucial to label both axes correctly on a graph?
What does ensuring that the scale on both axes align well with the range of values for each variable achieve?
What does ensuring that the scale on both axes align well with the range of values for each variable achieve?
Which aspect of graph creation involves adjusting scales to better display trends or relationships between variables?
Which aspect of graph creation involves adjusting scales to better display trends or relationships between variables?
What should you do when joining plotted points on a straight line graph?
What should you do when joining plotted points on a straight line graph?
Which technique is important for ensuring each point's corresponding value can be identified on a graph?
Which technique is important for ensuring each point's corresponding value can be identified on a graph?
Why is it important to label both axes with appropriate units like kilometers per hour (km/hour)?
Why is it important to label both axes with appropriate units like kilometers per hour (km/hour)?
What role do the x-axis and y-axis scaling play in graph interpretation?
What role do the x-axis and y-axis scaling play in graph interpretation?
Flashcards are hidden until you start studying
Study Notes
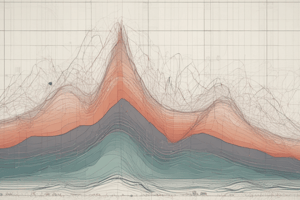
Plotting and Interpreting Straight Line Graphs
Title of Graph
When creating a graph, it is essential to choose an appropriate title that clearly conveys the purpose of your plot. The title should include enough information so that someone else can understand what data is being displayed and what conclusions might be drawn from looking at the graph.
X-Axis
The x-axis represents the independent variable, which is typically measured in time or quantity. For example, if you are graphing the number of miles driven against fuel consumption, then distance would be represented along the x-axis. Ensure that the scale on the x-axis accurately reflects the range of values for the independent variable, providing a clear representation of the relationship between the two variables.
Y-Axis
The y-axis represents the dependent variable, usually measured in terms such as speed, height, weight, or amount. In the same fuel consumption example mentioned earlier, the amount of fuel consumed per mile would be plotted along the y-axis. Similar to the x-axis, make sure that the scale on the y-axis aligns well with the range of values for the dependent variable. This ensures that any trends or correlations within the data are visible and easily interpretable.
Labeling of Axes
It is crucial to label both axes correctly when creating a graph. The labels should directly correspond to the units of measurement for each variable, ensuring that others can interpret the data correctly. For example, if measuring speed on a graph, label both axes with "speed" and provide units like kilometers per hour (km/hour).
Scaling of Axes
The scaling of your axes plays a significant role in the interpretation of your graph. When choosing scales for your x-axis and y-axis, ensure that they are appropriate to represent the range of values within the data. In some cases, you may need to adjust the scaling to better display trends or relationships between variables. Keep in mind that differences in scale between the x-axis and y-axis might affect how the graph appears visually and could impact someone's understanding of the presented information.
Plotting Point
To plot points on a straight line graph, first determine which point represents the coordinates of each variable (x and y), then simply place a dot at their intersection. These points will form a line when connected by a ruler or other tool. Be sure to label each point clearly so that its corresponding value can be identified.
Join of Straight Line
When joining the plotted points to form a continuous line, use a pen or ruler to draw a line following the sequence of the points. This line represents the trend or relationship between the two variables being graphed. Ensure that the line is smooth and does not cross over any points unless there is a specific reason for doing so. If crossing occurs, mark this by drawing arrows to indicate the direction of change.
In conclusion, creating a well-organized and accurate straight line graph involves careful consideration of various factors such as axis titles, labeling, scaling, data collection methods, and visual representation techniques. By paying close attention to these details, you can effectively communicate complex information through clear and concise graphs.
Studying That Suits You
Use AI to generate personalized quizzes and flashcards to suit your learning preferences.