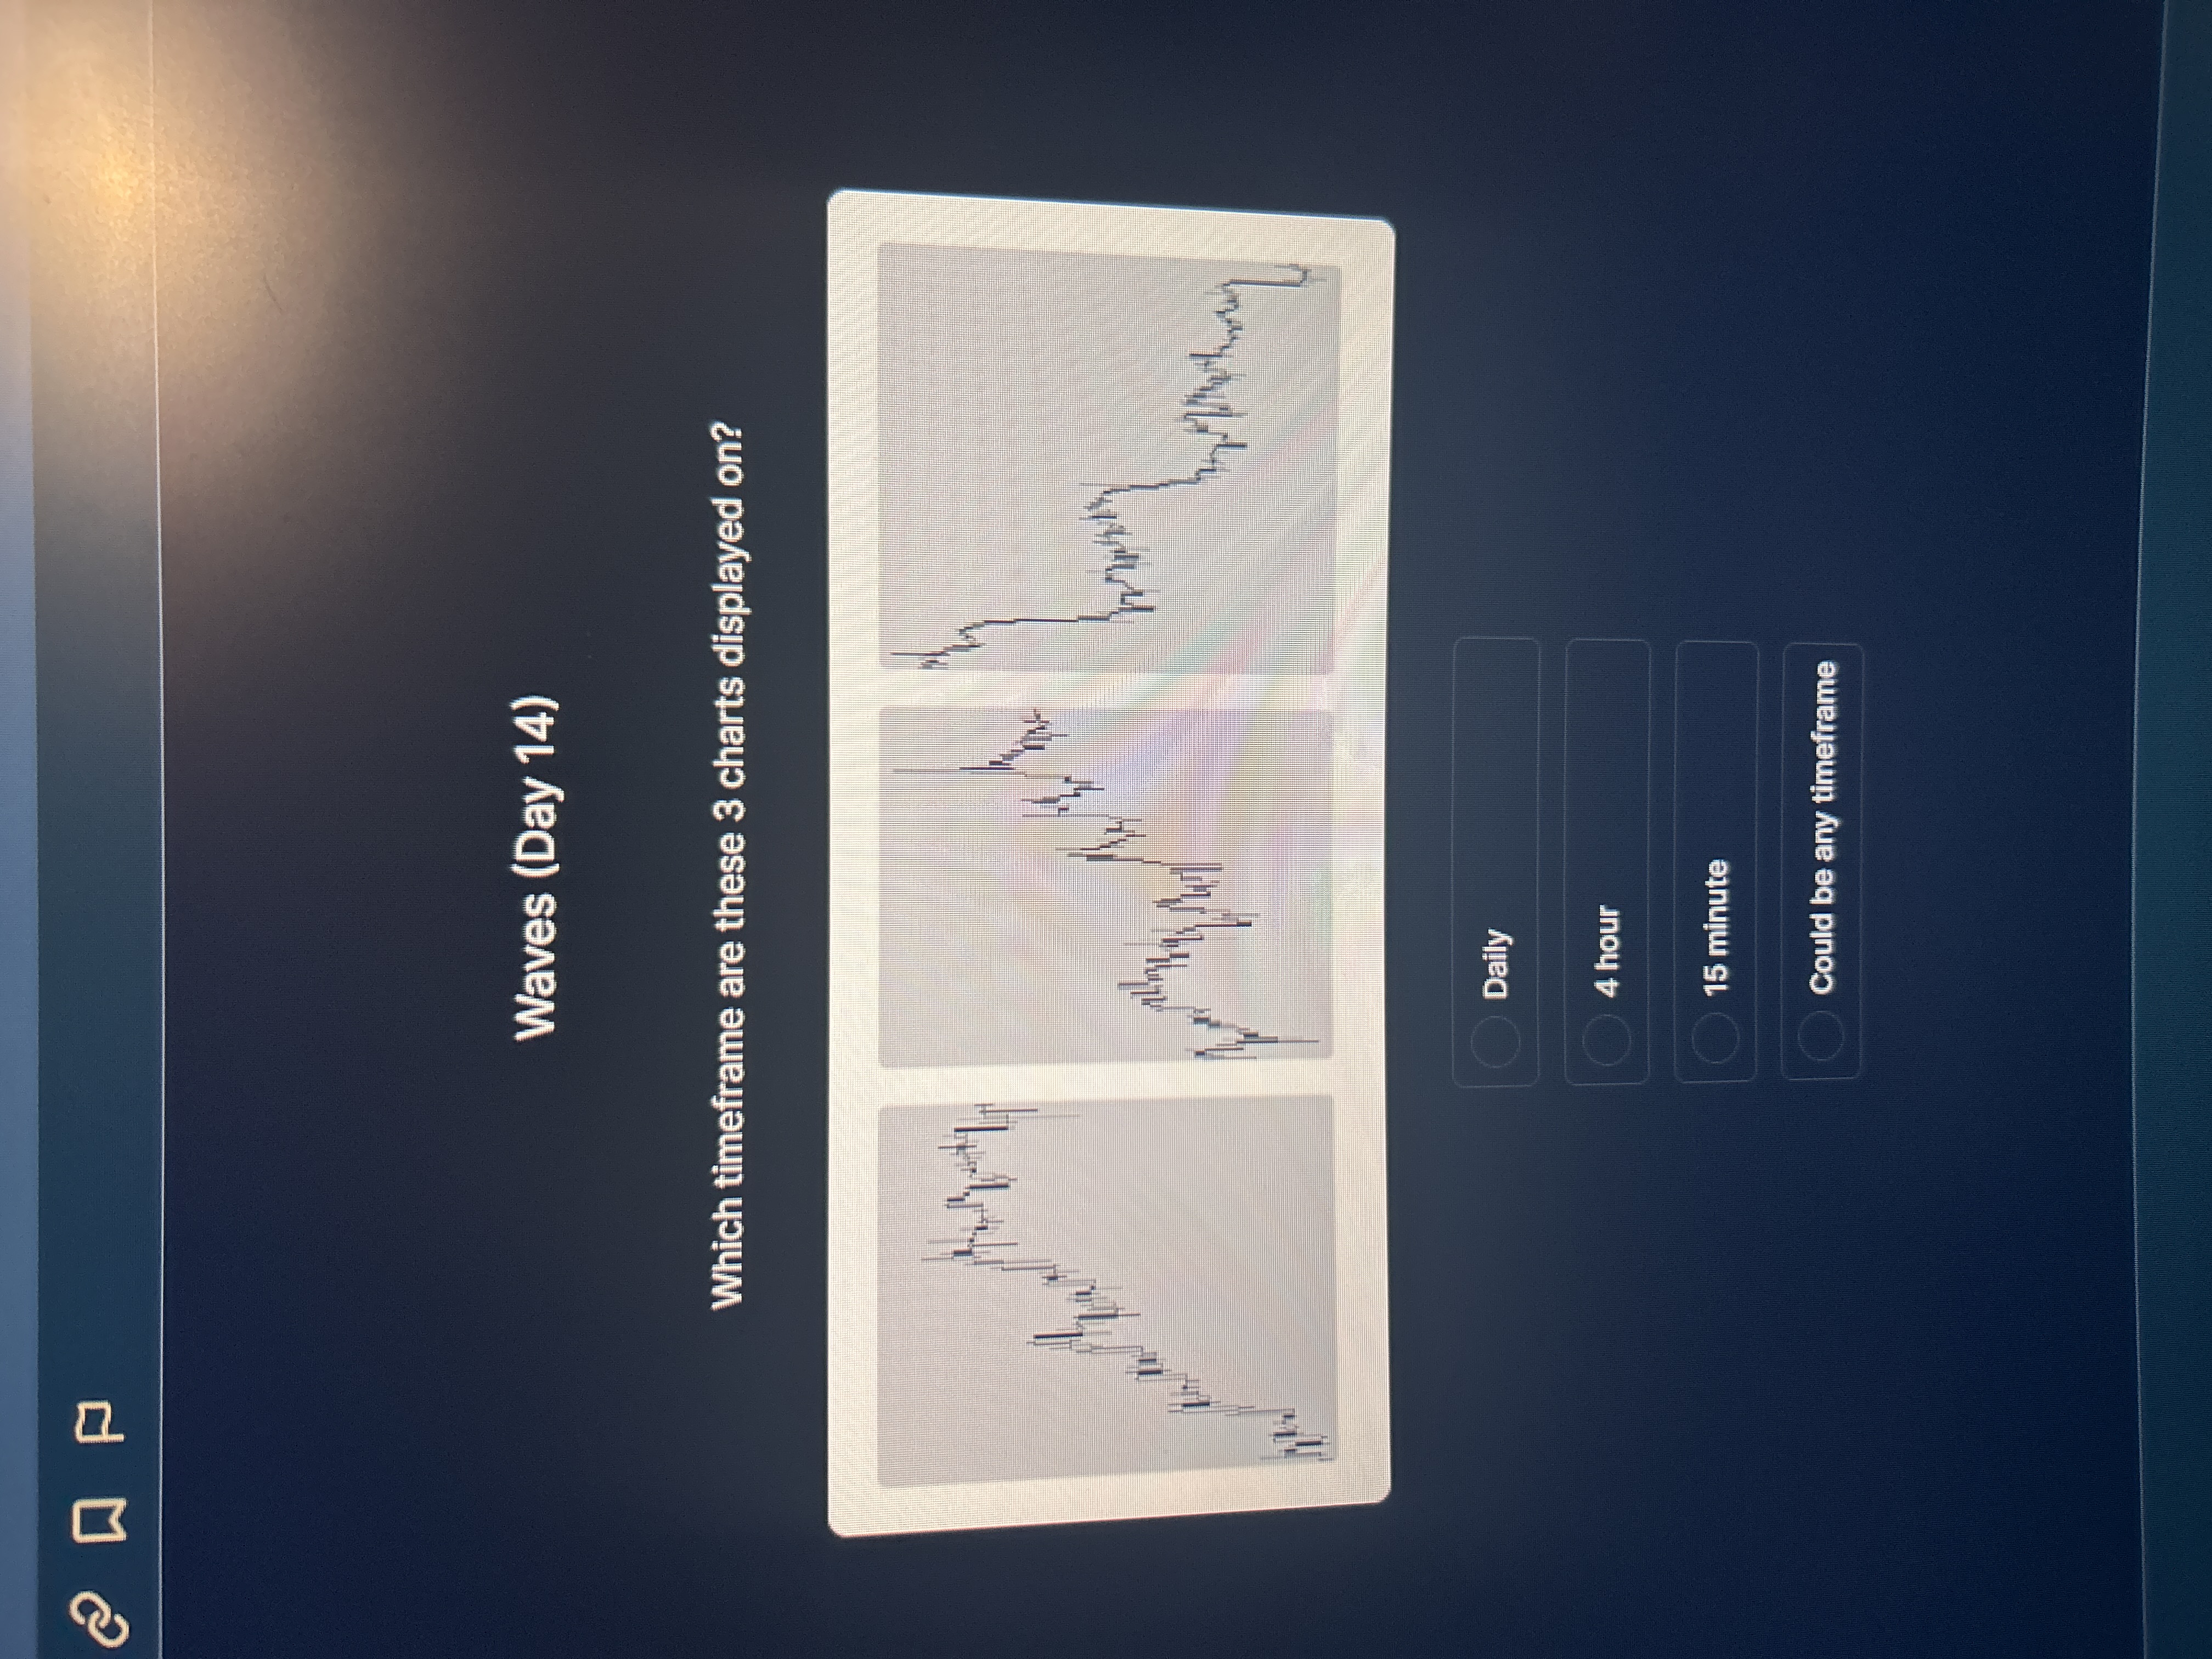
Which timeframe are these 3 charts displayed on?

Understand the Problem
The question is asking about the timeframe represented by the three charts shown in the image. It requires knowledge of how to interpret charts and recognize different timeframes typically used in trading.
Answer
4 hour
The final answer is 4 hour.
Answer for screen readers
The final answer is 4 hour.
More Information
The charts display candlestick patterns with trend indications typical of a 4-hour timeframe, allowing medium-term trend analysis.
Sources
- Which timeframe are these 3 charts displayed on? - Quizgecko - quizgecko.com
AI-generated content may contain errors. Please verify critical information