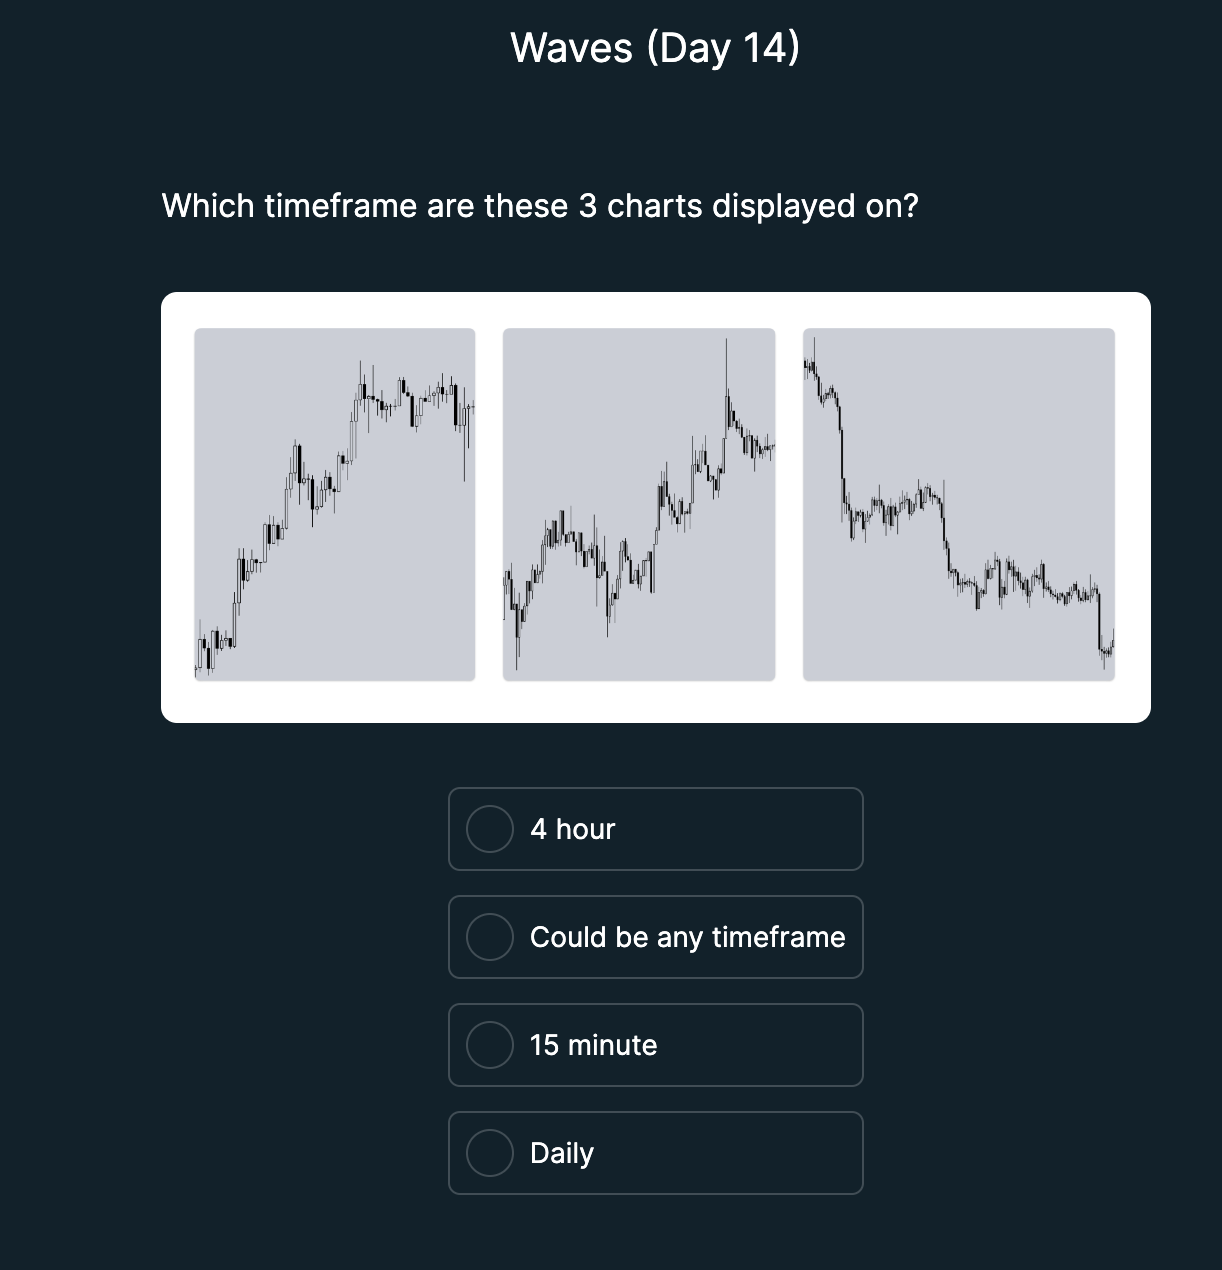
Which timeframe are these 3 charts displayed on?
Understand the Problem
The question is asking about the specific timeframe displayed on three charts, likely related to trading or market analysis.
Answer
4 hour
The timeframe is 4 hour.
Answer for screen readers
The timeframe is 4 hour.
More Information
These three charts display candlestick patterns with a trend indication typical of a 4-hour timeframe, which allows traders to see medium-term trends without the noise of shorter timeframes or the broad patterns of daily charts.
Tips
A common mistake is confusing short-term fluctuations for long-term trends. Ensure you verify the characteristics specific to each timeframe.
Sources
- Multiple Time Frames: How to Use Them In Your Trading - Investopedia - investopedia.com
- Trade with 3 Time Frames: A Multi-Timeframe Analysis Strategy for - LiteFinance - litefinance.org
AI-generated content may contain errors. Please verify critical information
Thank you for voting!