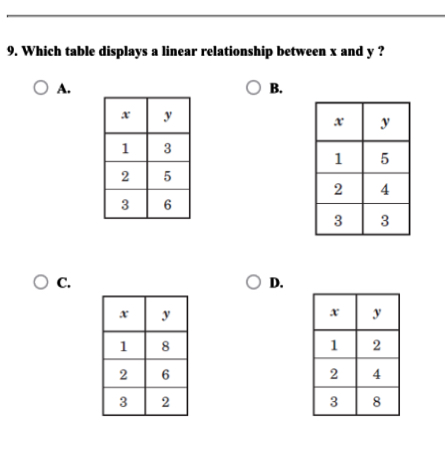
Which table displays a linear relationship between x and y?

Understand the Problem
The question is asking which of the provided tables shows a linear relationship between the variables x and y. A linear relationship can be identified if the change in y is consistent with the change in x across the values in the tables.
Answer
D
Answer for screen readers
The table that displays a linear relationship between $x$ and $y$ is D.
Steps to Solve
- Identify the change in y for each change in x
For each table, calculate the change in $y$ as $x$ increases:
- Table A:
- $1 \to 2$: $3 \to 5$ (change: $2$)
- $2 \to 3$: $5 \to 6$ (change: $1$)
- Table B:
- $1 \to 2$: $5 \to 6$ (change: $1$)
- $2 \to 3$: $6 \to 8$ (change: $2$)
- Table C:
- $1 \to 2$: $8 \to 3$ (change: $-5$)
- $2 \to 3$: $3 \to 2$ (change: $-1$)
- Table D:
- $1 \to 2$: $2 \to 4$ (change: $2$)
- $2 \to 3$: $4 \to 6$ (change: $2$)
- Check consistency of changes
A linear relationship means the change in $y$ should be consistent (the same) for equal changes in $x$:
- Table A: Changes are inconsistent ($2$, then $1$)
- Table B: Changes are inconsistent ($1$, then $2$)
- Table C: Changes are inconsistent ($-5$, then $-1$)
- Table D: Changes are consistent ($2$, then $2$)
- Conclusion based on findings
From the analysis, only Table D shows a consistent change, indicating a linear relationship.
The table that displays a linear relationship between $x$ and $y$ is D.
More Information
Linear relationships imply that as one variable increases, the other increases by a consistent amount. This can often be visualized on a graph as a straight line.
Tips
- Assuming consistency without checking all intervals in the table. Always compare the changes across all intervals for accuracy.
- Confusing linear relationships with proportional relationships; linear can involve a constant addition or subtraction rather than multiplication.
AI-generated content may contain errors. Please verify critical information