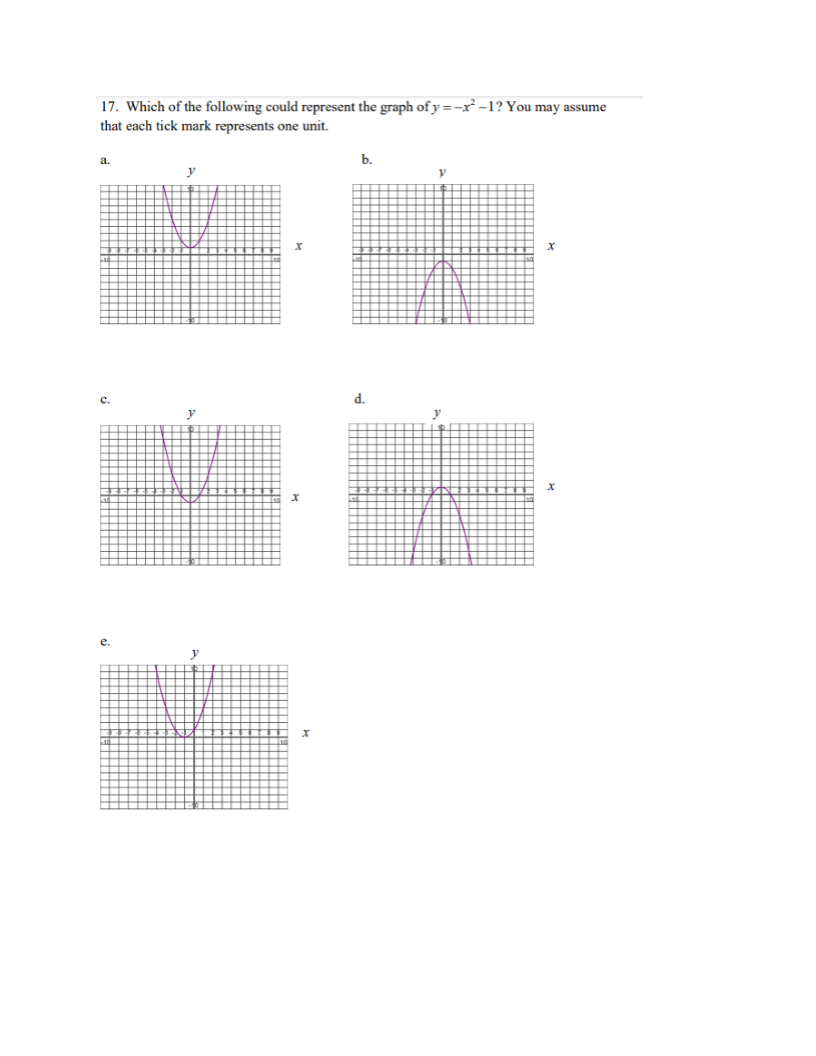
Which of the following could represent the graph of y = -x² - 1? You may assume that each tick mark represents one unit.
Understand the Problem
The question asks us to identify which of the given graphs represents the equation y = -x² - 1, assuming each tick mark on the axes represents one unit. We're looking for a parabola that opens downwards (due to the negative coefficient of x²) and has a y-intercept of -1.
Answer
d.
Answer for screen readers
d.
Steps to Solve
- Identify the general shape of the graph
The equation $y = -x^2 - 1$ is a quadratic equation, which represents a parabola. The coefficient of the $x^2$ term is negative (-1), so the parabola opens downwards.
- Determine the y-intercept
The y-intercept is the point where the graph intersects the y-axis (where $x = 0$). Substitute $x = 0$ into the equation: $y = -(0)^2 - 1 = -1$. So, the y-intercept is -1.
-
Analyze the given graphs We need to find a graph that is a parabola opening downwards and has a y-intercept of -1.
-
Evaluate given options Looking at the options, graph d is a parabola that opens downwards and intersects the y-axis at -1.
d.
More Information
The graph of $y = -x^2 - 1$ is a parabola that is a transformation of the basic parabola $y = x^2$. The negative sign in front of the $x^2$ term reflects the parabola across the x-axis, making it open downwards. The "-1" shifts the entire parabola down by one unit.
Tips
A common mistake is to confuse the sign of the coefficient of $x^2$. A positive coefficient means the parabola opens upwards, while a negative coefficient means it opens downwards. Also, it's important to correctly identify the y-intercept from the equation.
AI-generated content may contain errors. Please verify critical information