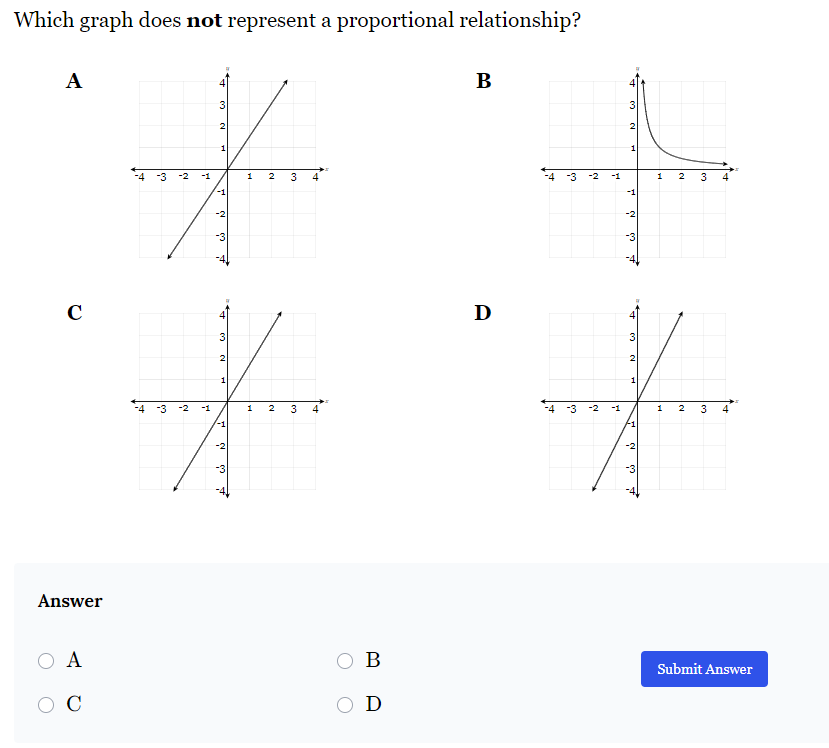
Which graph does not represent a proportional relationship?

Understand the Problem
The question is asking which of the provided graphs does not depict a proportional relationship. A proportional relationship is characterized by a constant ratio between the variables, often represented graphically as a straight line that passes through the origin. We need to analyze the graphs labeled A, B, C, and D to determine which one does not fit this criterion.
Answer
B
Answer for screen readers
The graph that does not represent a proportional relationship is B.
Steps to Solve
-
Identify Features of Proportional Relationships
A proportional relationship is characterized by a straight line that passes through the origin (0,0) and has a constant slope. -
Analyze Each Graph
- Graph A: It is a straight line that passes through the origin, indicating it represents a proportional relationship.
- Graph B: This graph shows a curve that does not pass through the origin; it is a non-linear relationship.
- Graph C: Like A, this graph is a straight line passing through the origin, indicating a proportional relationship.
- Graph D: This graph is also a straight line that passes through the origin, indicating a proportional relationship.
- Determine Which Graph Does Not Represent a Proportional Relationship
By analyzing all graphs, Graph B stands out as it does not meet the criteria of a straight line through the origin.
The graph that does not represent a proportional relationship is B.
More Information
Graph B depicts a curve that approaches the x-axis but never crosses it, indicating a non-linear relationship. The other graphs either show straight lines that pass through the origin, confirming they represent proportional relationships.
Tips
- Confusing non-linear graphs with linear graphs. Always check if the relationship passes through the origin.
- Misidentifying the constant slope; proportional relationships should maintain a consistent ratio throughout.
AI-generated content may contain errors. Please verify critical information