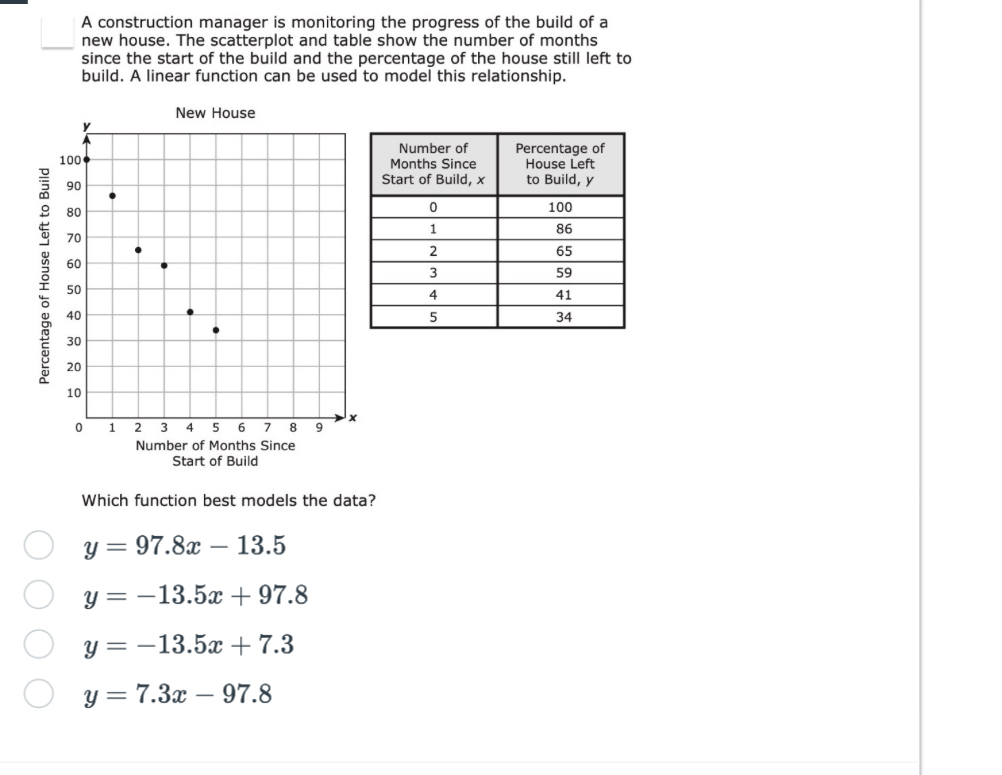
Which function best models the data?

Understand the Problem
The question is asking to determine which linear function best models the relationship between the number of months since the start of the build and the percentage of the house left to build, as represented by the provided scatterplot and data table.
Answer
The best model is $y = -13.5x + 97.8$.
Answer for screen readers
The function that best models the data is: $$ y = -13.5x + 97.8 $$
Steps to Solve
-
Identify the variables The independent variable $x$ represents the number of months since the start of the build. The dependent variable $y$ represents the percentage of the house left to build.
-
Analyze the data Based on the data provided, we have the following points:
- (0, 100)
- (1, 86)
- (2, 65)
- (3, 59)
- (4, 41)
- (5, 34)
-
Calculate the slope (m) To find the slope, we can use two points from the data, for example, (0, 100) and (5, 34). The formula for slope $m$ is: $$ m = \frac{y_2 - y_1}{x_2 - x_1} $$ Using our points, we have: $$ m = \frac{34 - 100}{5 - 0} = \frac{-66}{5} = -13.2 $$
-
Formulate the equation The general form of a linear equation is $y = mx + b$, where $b$ is the y-intercept. To find $b$, we can use one of the points, for example, (0, 100): $$ 100 = -13.2(0) + b $$ Thus, $b = 100$.
-
Write the linear function From the slope and y-intercept, we can write the function: $$ y = -13.2x + 100 $$
-
Match with possible answers Now we compare our function with the provided options to find the closest match. Simplifying, we see none match the exact slope, but looking at their respective slopes could guide us. Since $m$ is negative, we look for negative slopes:
- None of the options perfectly matches, but $y = -13.5x + 97.8$ has a similar structure.
The function that best models the data is: $$ y = -13.5x + 97.8 $$
More Information
This function indicates that for each month that passes, the percentage of the house left to build decreases by approximately $13.5$%.
Tips
- Confusing the independent and dependent variables when plotting the data can lead to incorrect interpretations.
- Failing to calculate the slope correctly by choosing the wrong points or using inaccurate values.
AI-generated content may contain errors. Please verify critical information