Which equation best represents the relationship shown in the graph between Celsius and Fahrenheit?
Understand the Problem
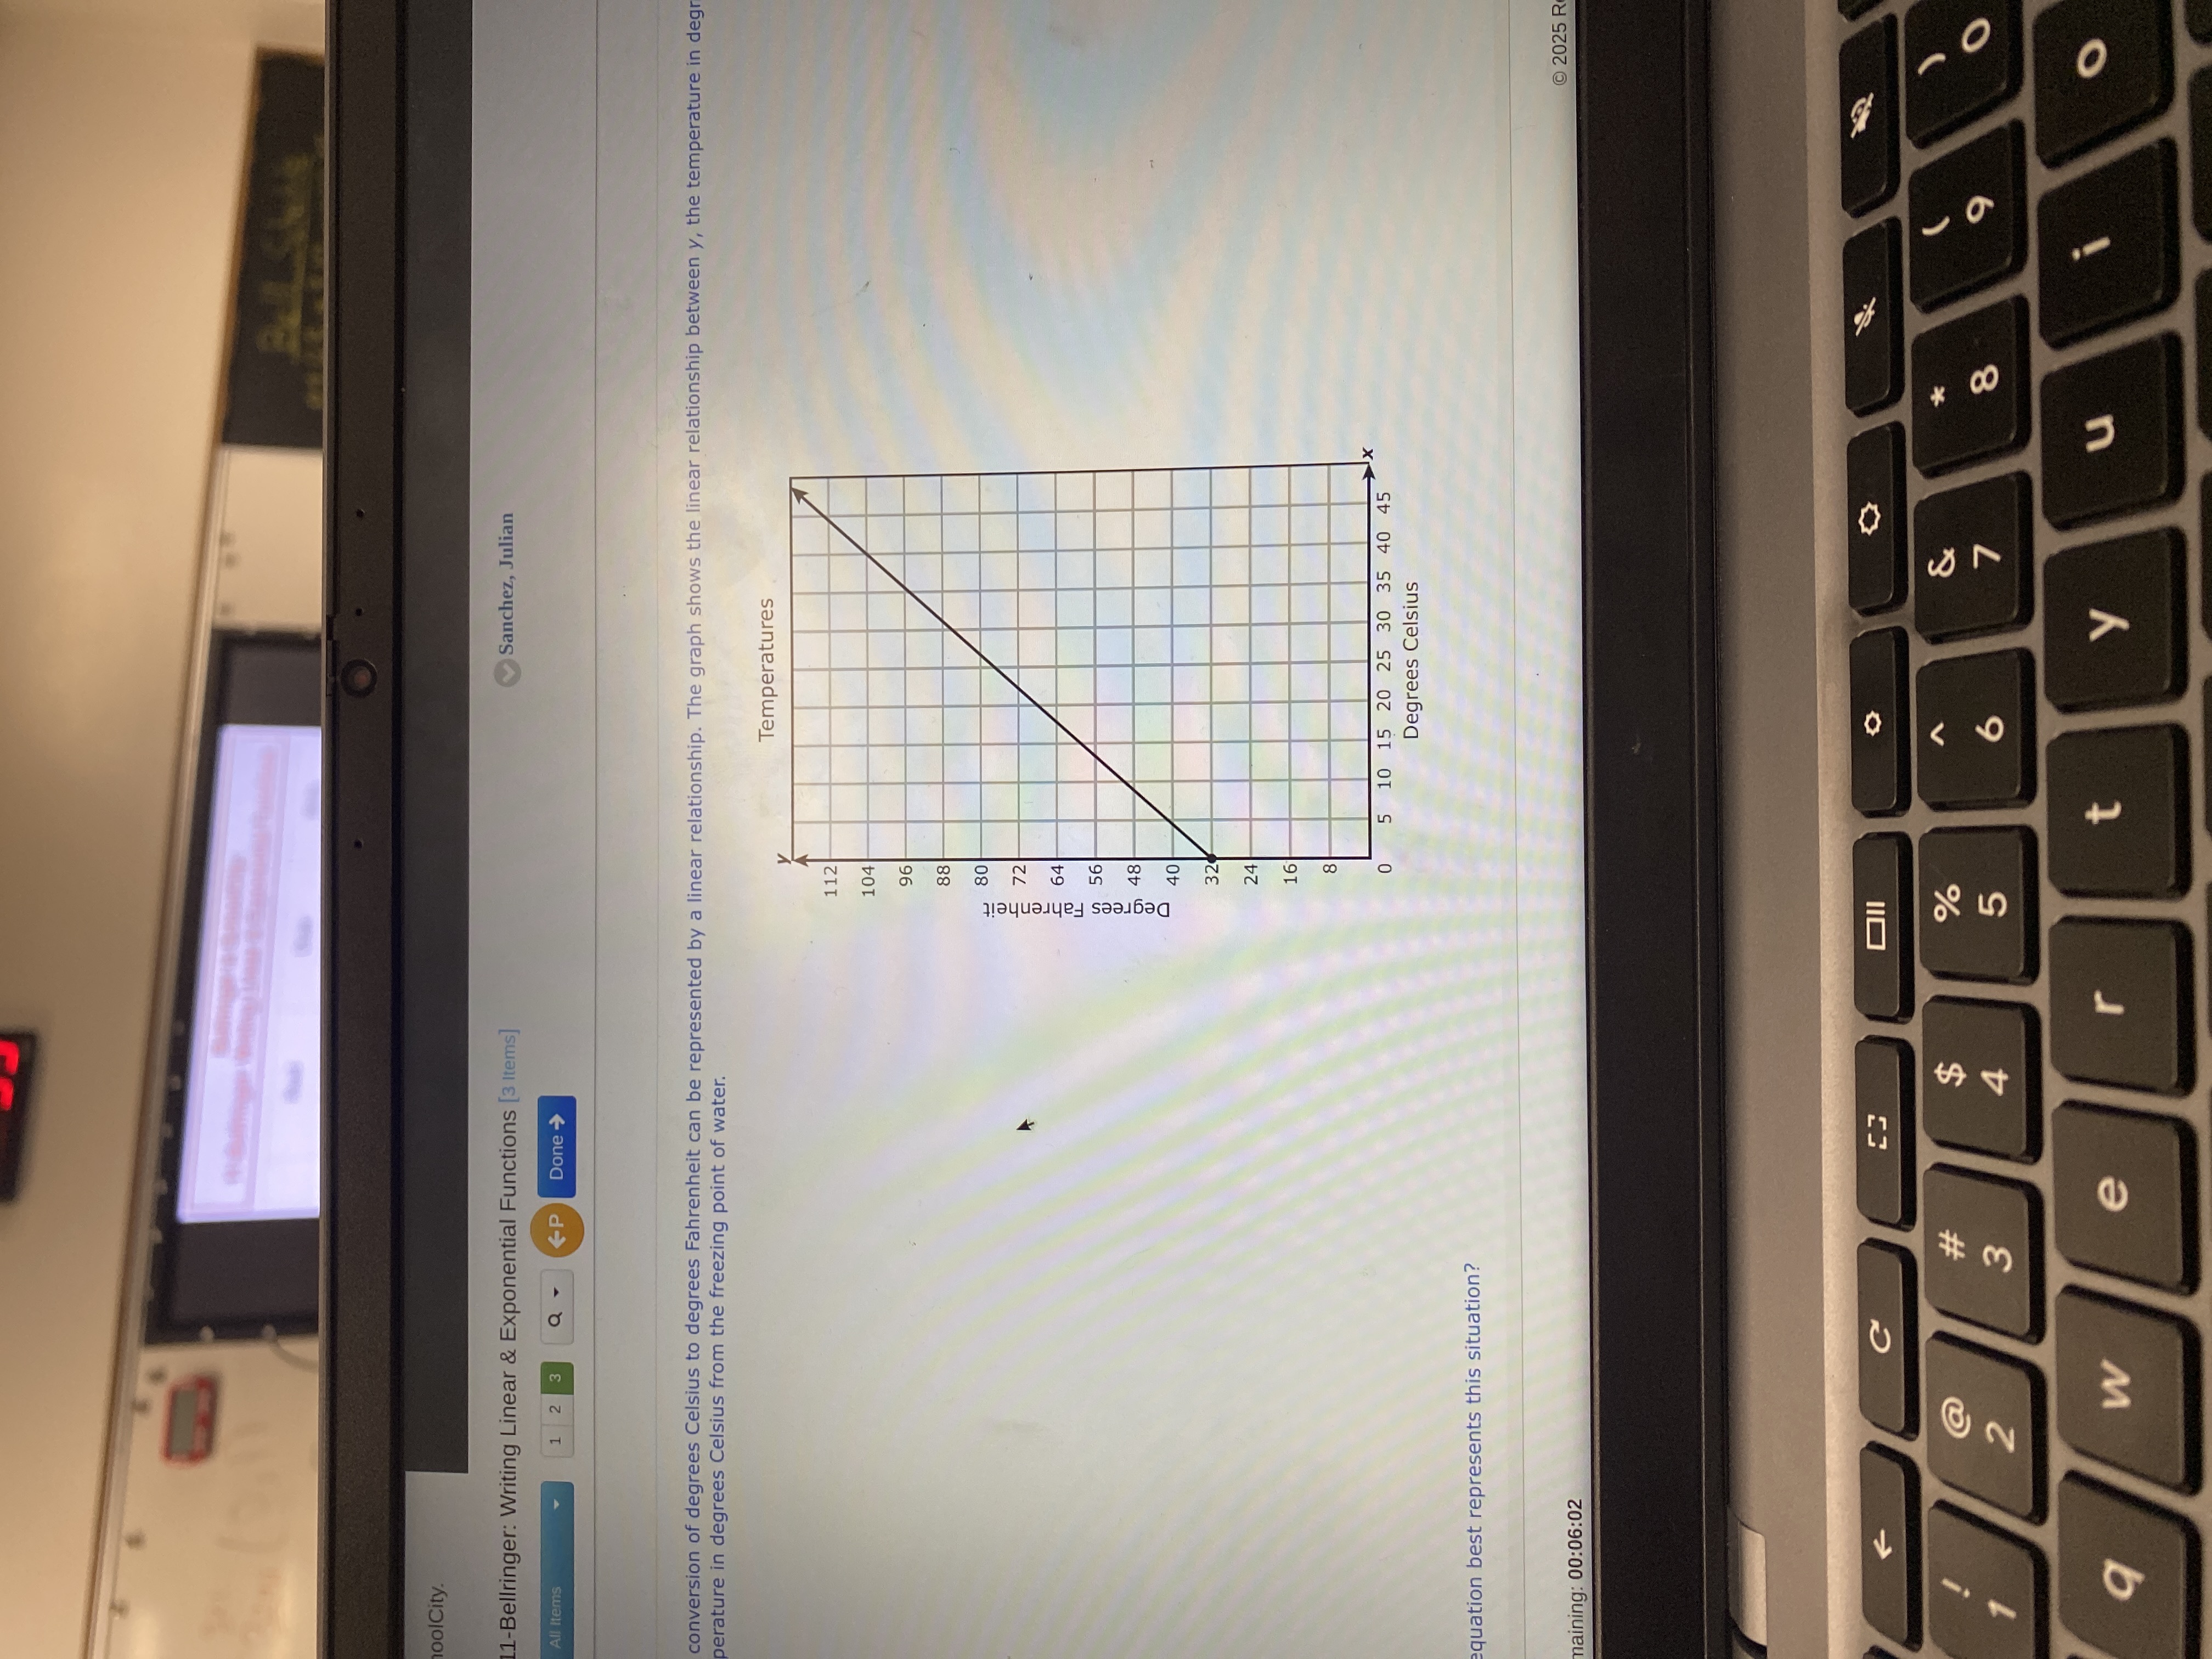
The graph shows the relationship between Celsius and Fahrenheit. The question asks you to find the equation that best describes this relationship using the provided graph.
Answer
$y = 1.8x + 32$
Answer for screen readers
$y = 1.8x + 32$
Steps to Solve
- Identify two points on the line
From the graph, we can identify two points. It looks like $(0, 32)$ and $(10, 50)$ are on the line.
- Calculate the slope
The slope, $m$, of a line passing through the points $(x_1, y_1)$ and $(x_2, y_2)$ is given by: $$ m = \frac{y_2 - y_1}{x_2 - x_1} $$ Using the identified points $(0, 32)$ and $(10, 50)$: $$ m = \frac{50 - 32}{10 - 0} = \frac{18}{10} = \frac{9}{5} = 1.8 $$
- Determine the y-intercept
The y-intercept, $b$, is the value of $y$ when $x = 0$. From the graph and the point $(0, 32)$, we can see that the y-intercept is 32.
- Write the equation in slope-intercept form
The slope-intercept form of a linear equation is $y = mx + b$, where $m$ is the slope and $b$ is the y-intercept. Substituting the values we found for $m$ and $b$: $$ y = 1.8x + 32 $$
$y = 1.8x + 32$
More Information
The equation $y = 1.8x + 32$ represents the conversion from Celsius to Fahrenheit, where $x$ is the temperature in Celsius and $y$ is the temperature in Fahrenheit. This matches the well-known formula $F = \frac{9}{5}C + 32$.
Tips
Null
AI-generated content may contain errors. Please verify critical information