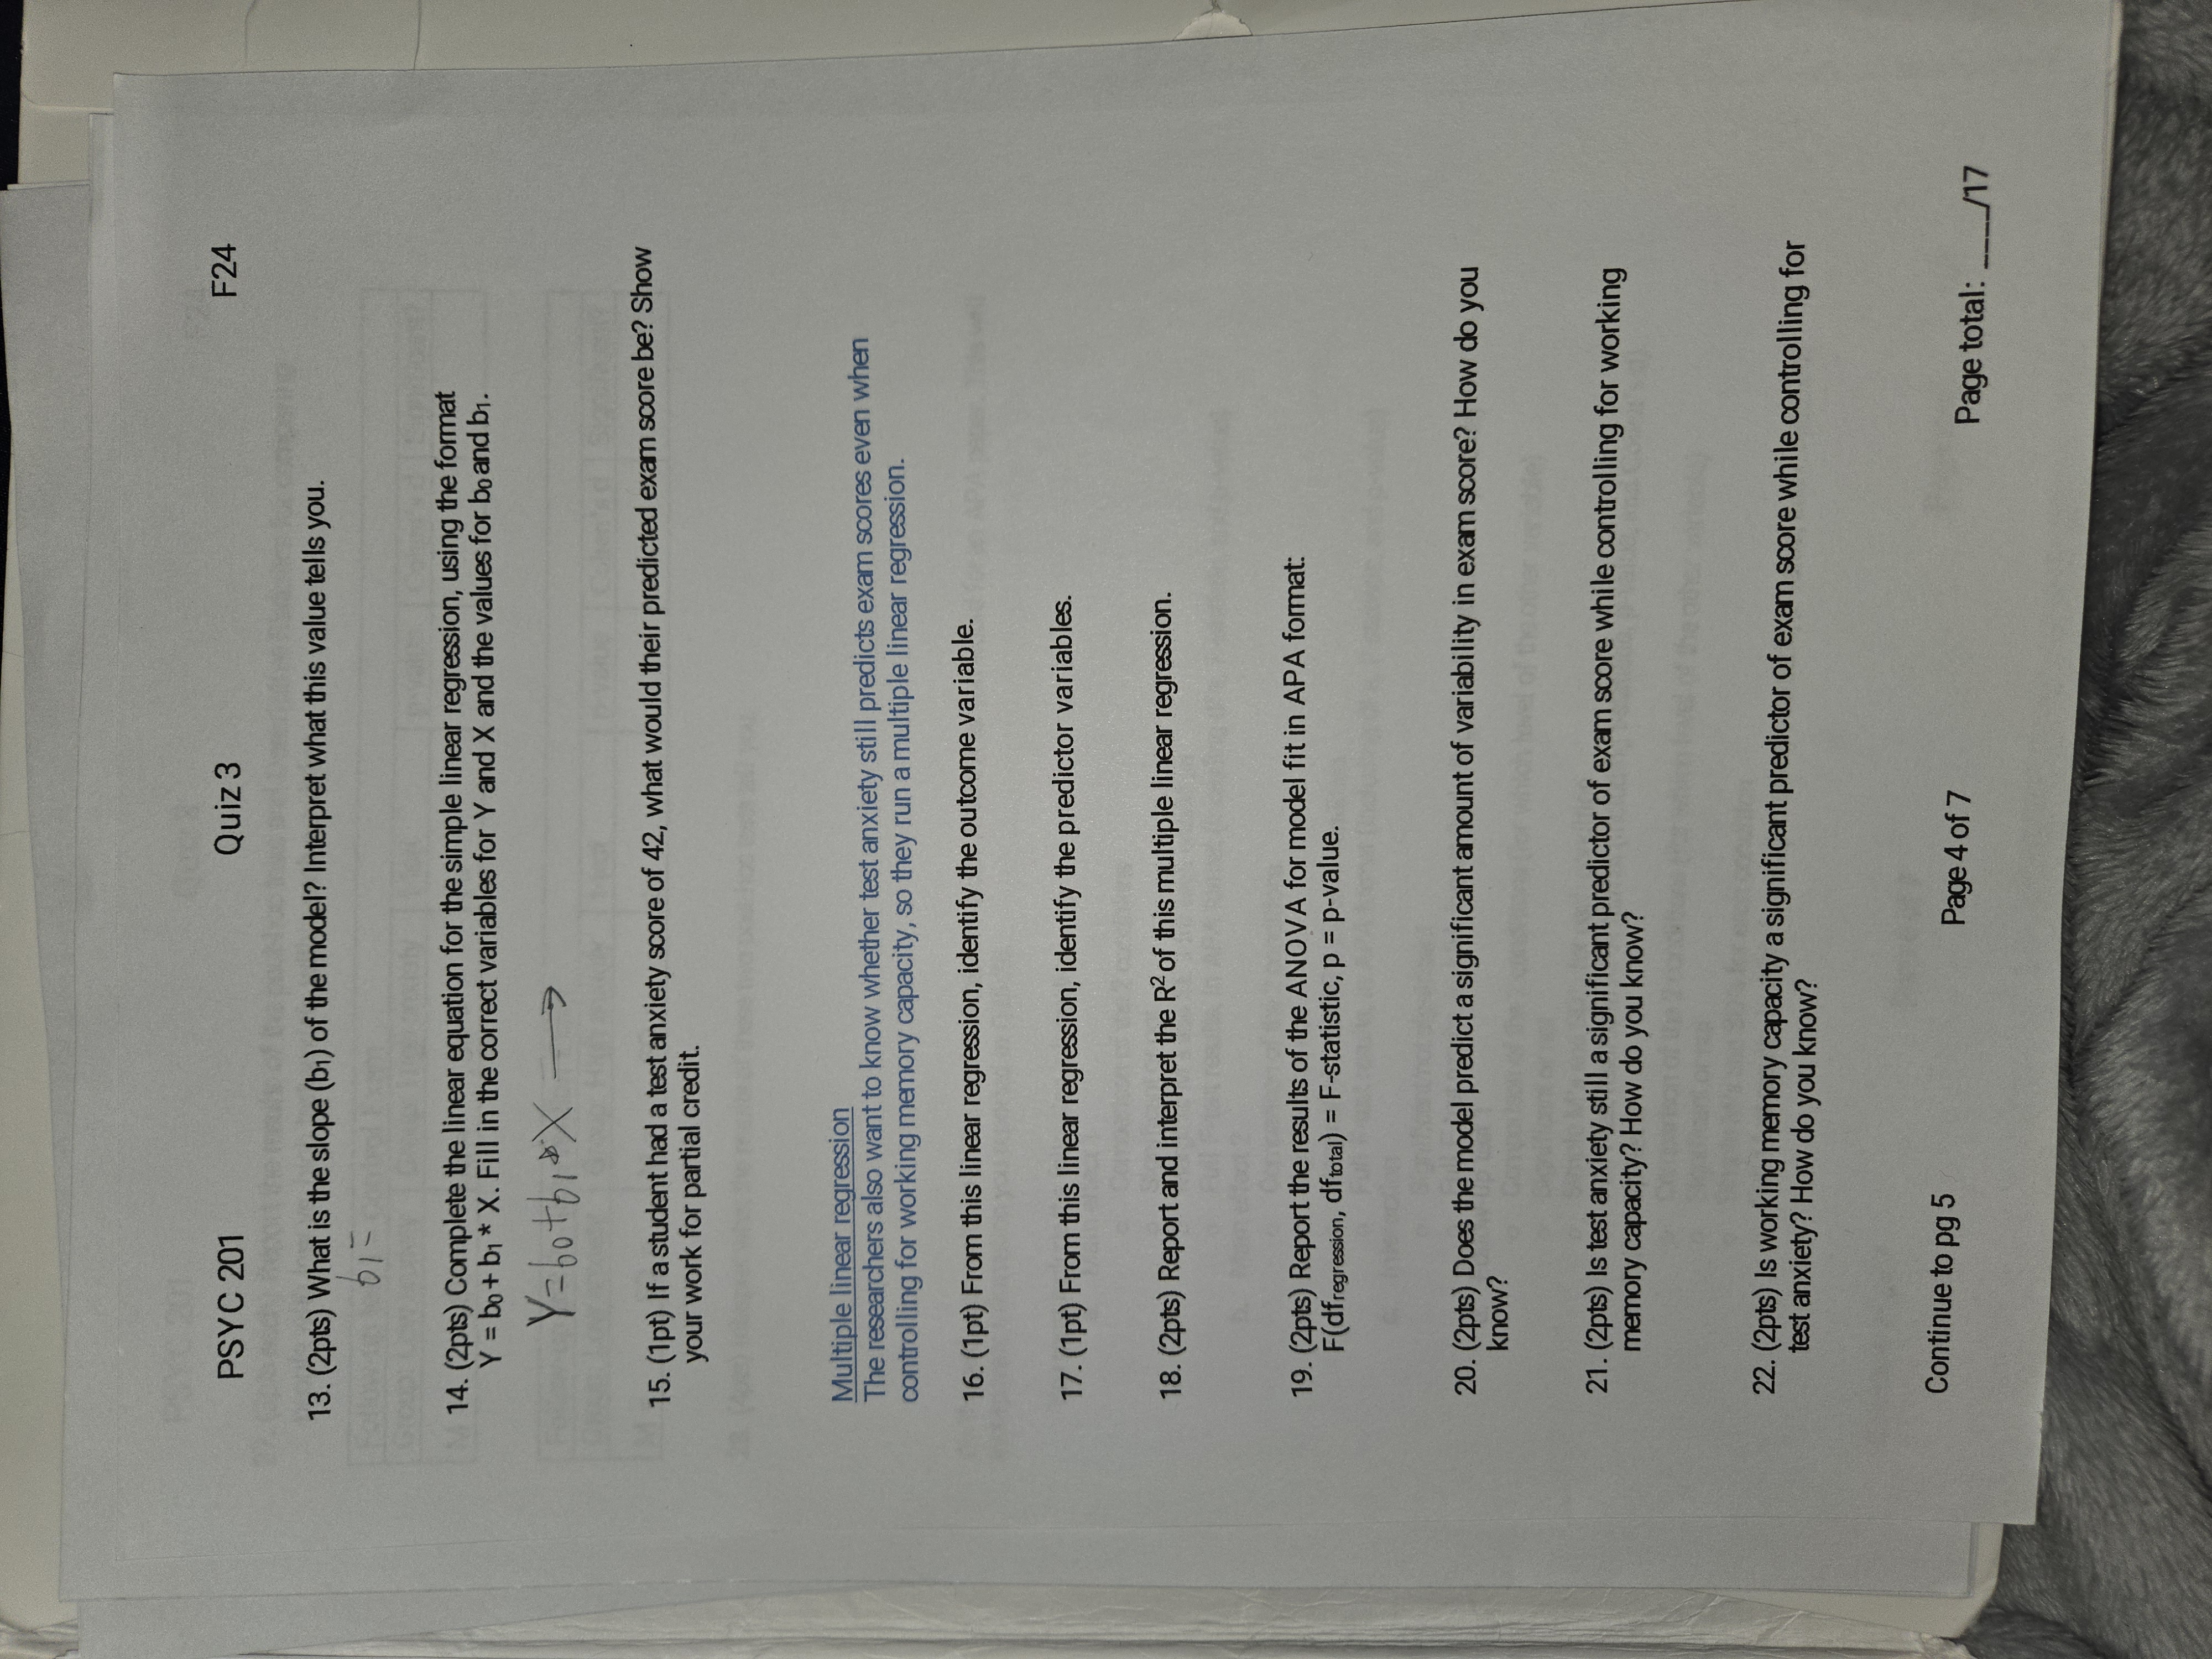
What is the slope (b1) of the model? Interpret what this value tells you. Complete the linear equation for simple linear regression. If a student had a test anxiety score of 42, wh... What is the slope (b1) of the model? Interpret what this value tells you. Complete the linear equation for simple linear regression. If a student had a test anxiety score of 42, what would their predicted exam score be? Identify the outcome and predictor variables from the linear regression. Report and interpret R² from the multiple linear regression. Report the ANOVA results in APA format. Does the model predict significant variability in exam score? Is test anxiety a significant predictor of exam score while controlling for working memory capacity? Is working memory capacity a significant predictor of exam score while controlling for test anxiety?

Understand the Problem
The question is focused on statistical analysis through multiple linear regression. It asks the user to interpret various statistical components such as the slope of the model, the linear equation, and the significance of variables in predicting exam scores in relation to test anxiety and working memory capacity.
Answer
Slope (b1) interprets change in exam score per anxiety unit. Use given equation for predictions. Analyze R² and ANOVA for model significance.
The final answer includes multiple components. The slope (b1) represents the change in the predicted exam score for each unit increase in test anxiety. For a student with a test anxiety score of 42, the predicted exam score can be calculated by plugging the value into the regression equation. The outcome variable is exam score, and the predictor variables are test anxiety and working memory capacity. R² shows the proportion of variance in exam scores explained by the model. ANOVA results indicate if the model fits the data well. Significant predictors indicate the presence of an effect while controlling for other variables.
Answer for screen readers
The final answer includes multiple components. The slope (b1) represents the change in the predicted exam score for each unit increase in test anxiety. For a student with a test anxiety score of 42, the predicted exam score can be calculated by plugging the value into the regression equation. The outcome variable is exam score, and the predictor variables are test anxiety and working memory capacity. R² shows the proportion of variance in exam scores explained by the model. ANOVA results indicate if the model fits the data well. Significant predictors indicate the presence of an effect while controlling for other variables.
More Information
The slope (b1) indicates how much the dependent variable (exam score) is expected to change with a one-unit increase in the independent variable (anxiety score). R² indicates the proportion of the variance in the dependent variable that is predictable from the independent variables.
Tips
A common mistake is confusing the roles of the intercept (b0) and the slope (b1). Ensure both are applied correctly in the equation. Additionally, correctly interpreting R² and ANOVA results is crucial for understanding model significance.
Sources
- How to Interpret the Slope of a Linear Regression Line [AP Statistics] - youtube.com
- IBM SPSS Statistics 26 Step by Step - Amazon S3 - s3-eu-west-1.amazonaws.com
- Simple Linear Regression Analysis - Chegg - chegg.com
AI-generated content may contain errors. Please verify critical information