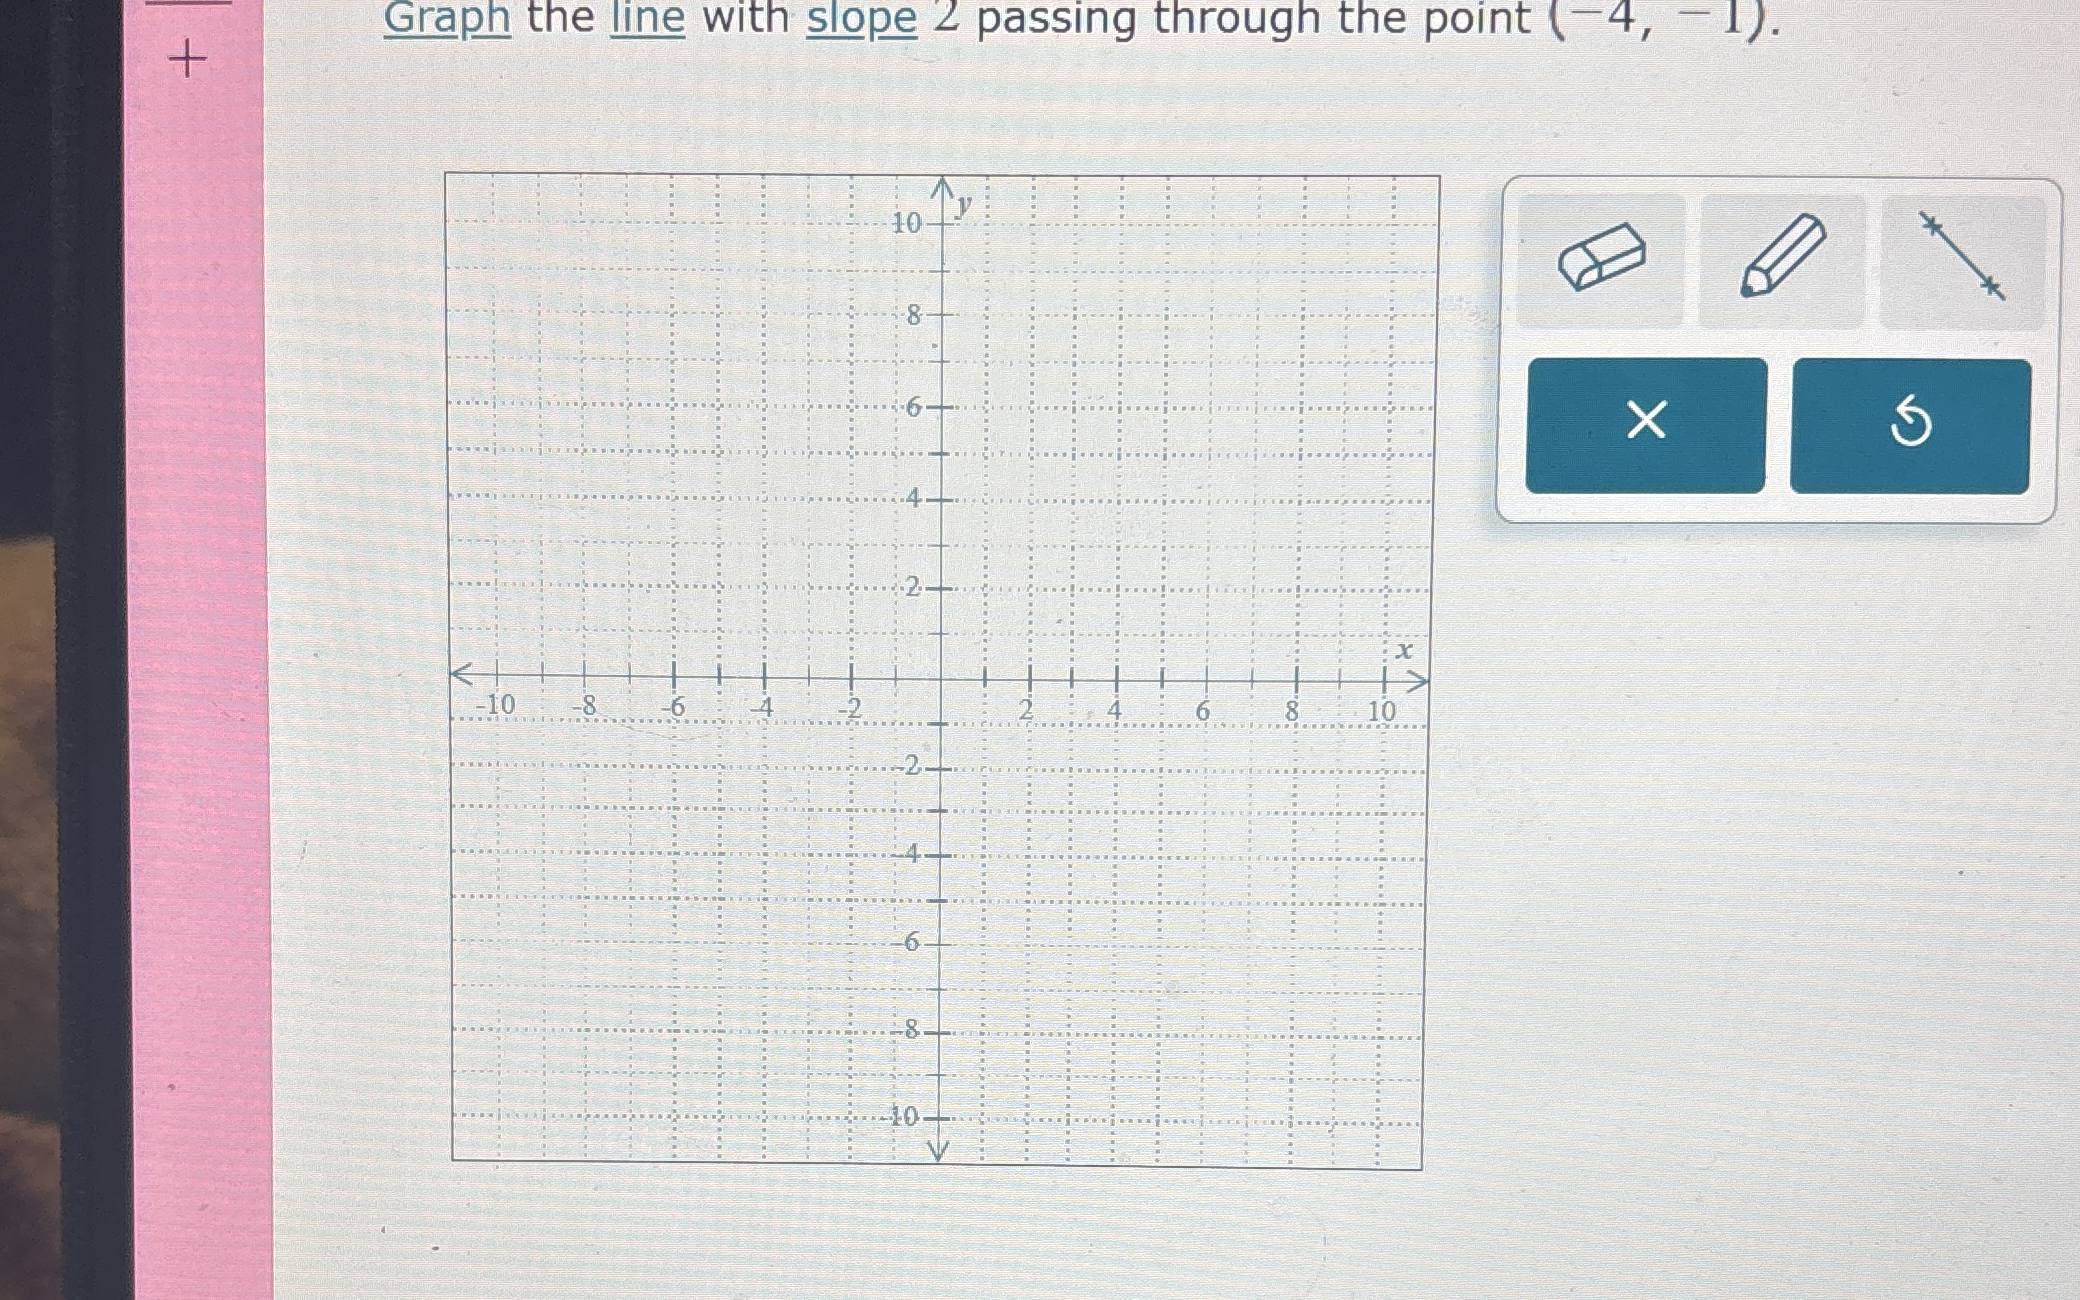
Graph the line with slope 2 passing through the point (-4, -1).
Understand the Problem
The question asks us to graph a line on the cartesian plane given its slope and a point it passes through. The slope is 2 and the point is (-4, -1).
Answer
The line passes through $(-4, -1)$ with a slope of 2.
Answer for screen readers
size(8cm);
import graph;

real f(real x) { return 2*x + 7; }

pair A = (-4,-1);
pair B = (-3,1);

draw(graph(f,-6,0),red);
dot(A);
dot(B);

label("$(-4, -1)$", A, SW);
label("$(-3, 1)$", B, N);

xaxis(-10,10,Arrows);
yaxis(-10,10,Arrows);
Steps to Solve
- Plot the given point
Plot the point $(-4, -1)$ on the Cartesian plane.
- Use the slope to find another point
The slope is given as $2$, which can be written as $\frac{2}{1}$. This means for every 1 unit increase in $x$, $y$ increases by 2 units. Starting from the point $(-4, -1)$, move 1 unit to the right and 2 units up. This gives us the new point $(-4 + 1, -1 + 2) = (-3, 1)$.
- Draw the line
Draw a straight line that passes through the points $(-4, -1)$ and $(-3, 1)$.
size(8cm);
import graph;

real f(real x) { return 2*x + 7; }

pair A = (-4,-1);
pair B = (-3,1);

draw(graph(f,-6,0),red);
dot(A);
dot(B);

label("$(-4, -1)$", A, SW);
label("$(-3, 1)$", B, N);

xaxis(-10,10,Arrows);
yaxis(-10,10,Arrows);
More Information
The graph of the line $y = 2x + 7$ passes through the point $(-4, -1)$ and has a slope of 2.
Tips
A common mistake is to misinterpret the slope. Remember that the slope is rise over run. So a slope of 2 means for every 1 unit you move to the right, you move 2 units up. Another common mistake is plotting the point incorrectly.
AI-generated content may contain errors. Please verify critical information