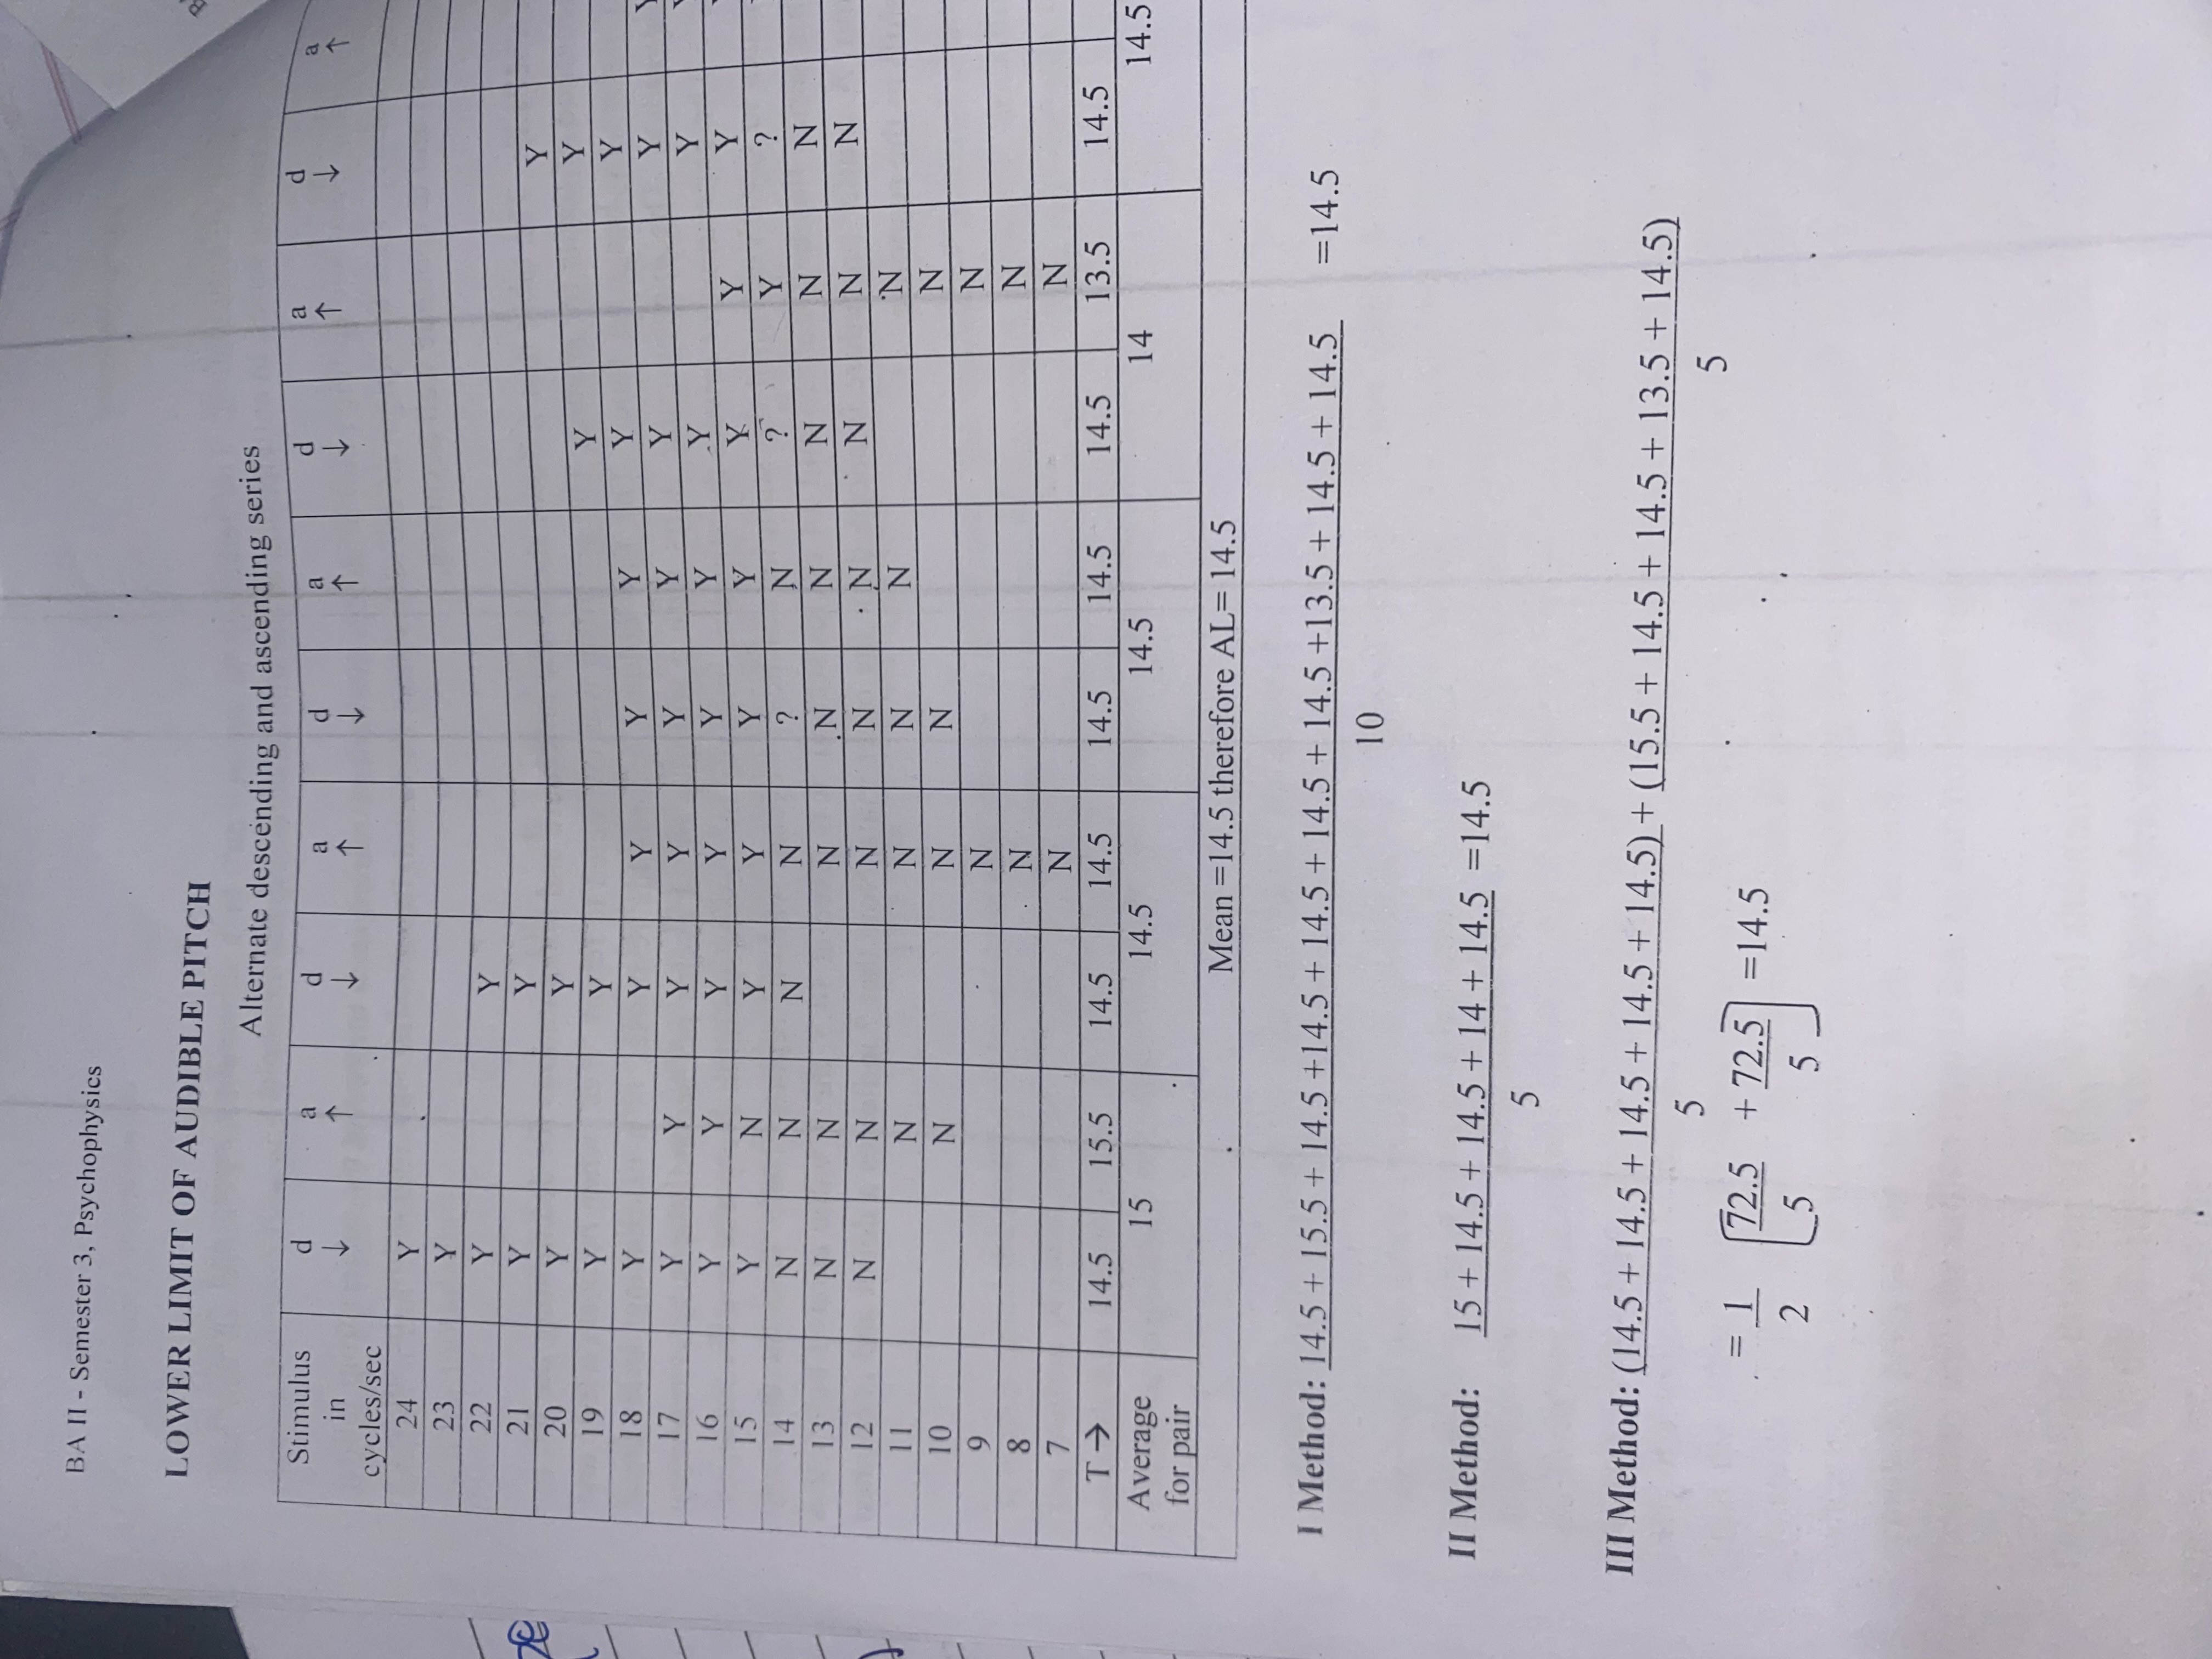
What is the mean of the lower limit of audible pitch data provided in the table?

Understand the Problem
The question involves analyzing data from an experiment on the lower limits of audible pitch, including calculations of averages and methods for determining results based on the stimuli and responses recorded. The goal is to derive the mean audible pitch based on the presented data.
Answer
The mean audible pitch is $14.5$.
Answer for screen readers
The mean audible pitch calculated from the data is $14.5$.
Steps to Solve
- Understanding the Data Structure
The table has various stimuli (in cycles per second) and their corresponding responses. Each response is marked as "Y" (Yes) or "N" (No), representing whether the pitch is audible.
- Calculating Averages for Each Method
The average loudness for each method (I, II, III) involves listing out the values used in the calculations. We then sum them and divide by the number of trials.
-
Method I: $$ \text{Average} = \frac{14.5 + 15.5 + 14.5 + 14.5 + 14.5 + 14.5 + 14.5 + 13.5 + 14.5 + 14.5}{10} $$
-
Method II: $$ \text{Average} = \frac{15 + 14.5 + 14.5 + 14 + 14.5}{5} $$
-
Method III: $$ \text{Average} = \frac{(14.5 + 14.5 + 14.5 + 14.5 + 14.5) + (15.5 + 14.5 + 14.5 + 13.5 + 14.5)}{5} $$
- Final Calculation of Mean
After calculating the averages for each method, we find the overall mean which corroborates the lower limit of audible pitch.
Average from all Methods: $$ \text{Mean} = 14.5 $$
The mean audible pitch calculated from the data is $14.5$.
More Information
The value of $14.5$ cycles/second is recognized as the average lower limit of audible pitch according to the experiment data. This result can inform further studies on human hearing and psychophysics.
Tips
- Forgetting to divide by the number of trials after summing responses.
- Miscalculating sums in the methods which can lead to incorrect averages.
AI-generated content may contain errors. Please verify critical information