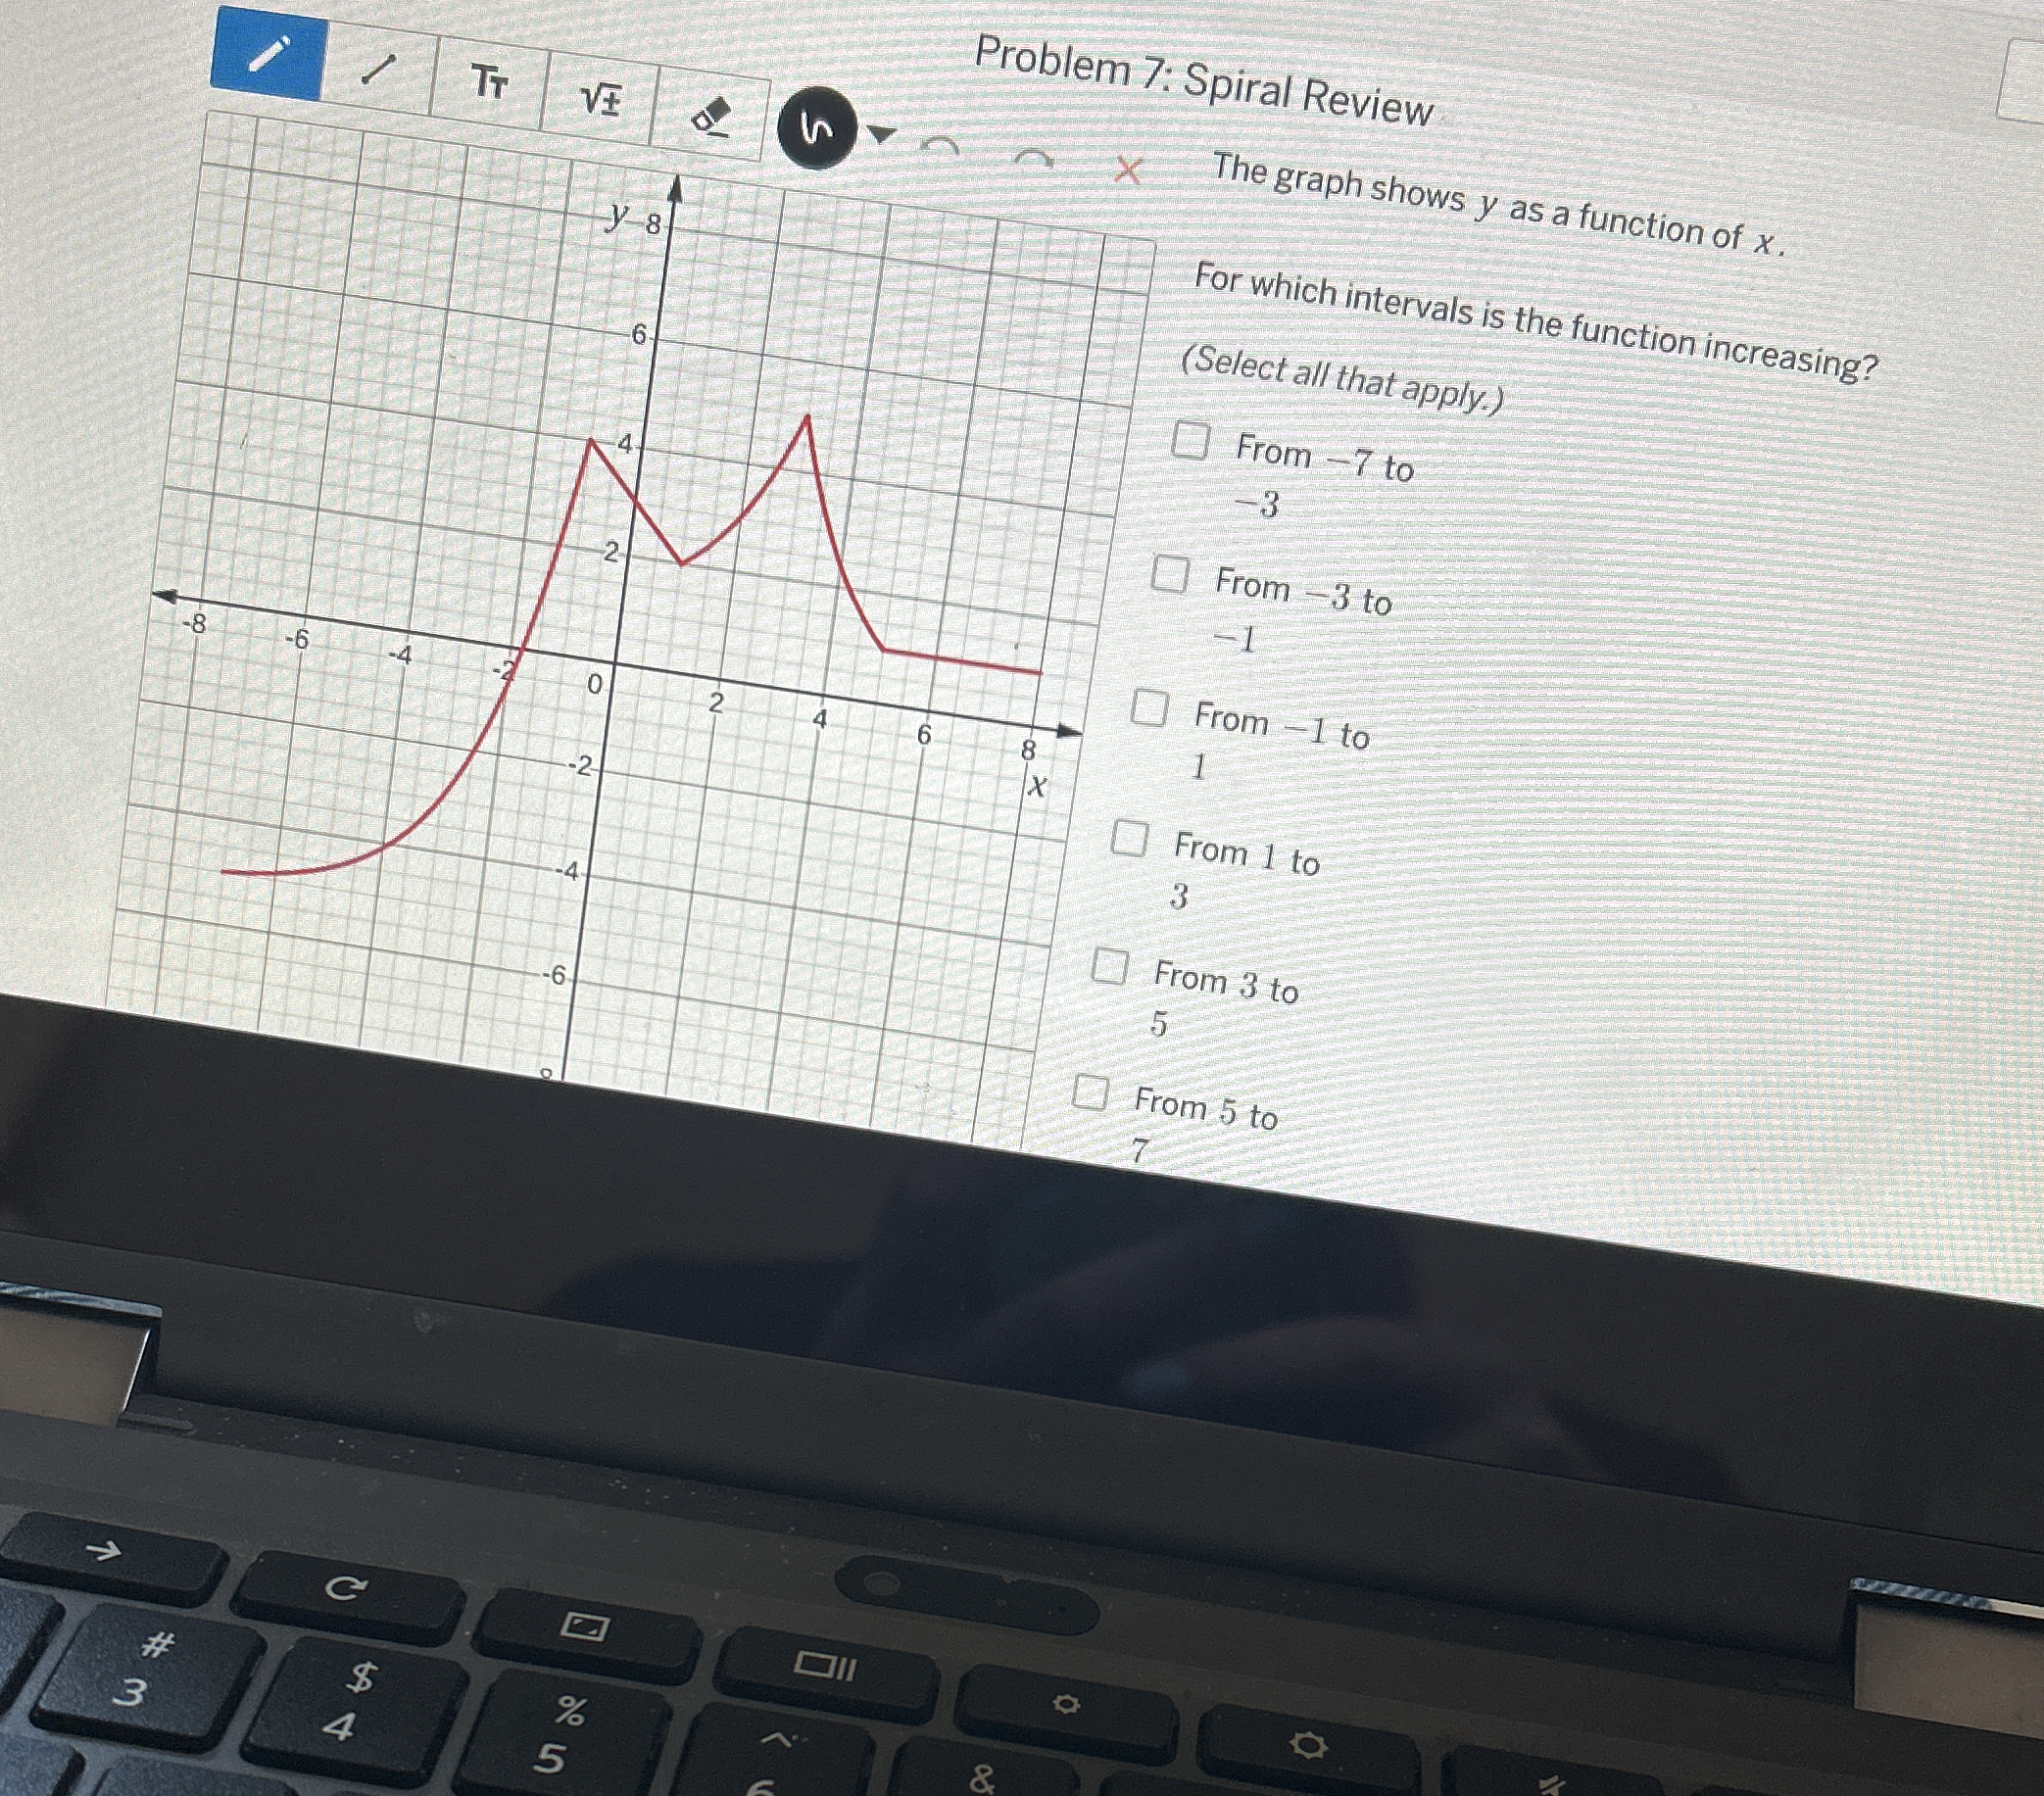
The graph shows y as a function of x. For which intervals is the function increasing? (Select all that apply.)
Understand the Problem
The question presents a graph of a function y = f(x) and asks to identify the intervals on the x-axis where the function is increasing. In simpler terms, we need to find the x ranges over which the y values on the graph go up as we move from left to right.
Answer
From -7 to -3 From -1 to 1
Answer for screen readers
From -7 to -3 From -1 to 1
Steps to Solve
-
Analyze the interval from -7 to -3
Examine the graph from $x = -7$ to $x = -3$. The y-values are increasing (the graph goes upwards) in this interval. Therefore, the function is increasing from -7 to -3. -
Analyze the interval from -3 to -1
Examine the graph from $x = -3$ to $x = -1$. The y-values are decreasing (the graph goes downwards) in this interval. Therefore, the function is decreasing from -3 to -1. -
Analyze the interval from -1 to 1
Examine the graph from $x = -1$ to $x = 1$. The y-values are increasing (the graph goes upwards) in this interval. Therefore, the function is increasing from -1 to 1. -
Analyze the interval from 1 to 3
Examine the graph from $x = 1$ to $x = 3$. The y-values are decreasing (the graph goes downwards) in this interval. Therefore, the function is decreasing from 1 to 3. -
Analyze the interval from 3 to 5
Examine the graph from $x = 3$ to $x = 5$. The y-values are decreasing (the graph goes downwards) in this interval. Therefore, the function is decreasing from 3 to 5. -
Analyze the interval from 5 to 7
Examine the graph from $x = 5$ to $x = 7$. The y-values are neither increasing nor decreasing (the graph is flat). Therefore, the function it not increasing from 5 to 7.
From -7 to -3 From -1 to 1
More Information
A function is said to be increasing on an interval if, for any two points $x_1$ and $x_2$ in the interval where $x_1 < x_2$, we have $f(x_1) < f(x_2)$. In simpler terms, as you move from left to right along the x-axis within that interval, the y-values are going up.
Tips
A common mistake is to confuse increasing and decreasing intervals. Carefully observe the direction of the graph (upward or downward) as you move from left to right.
AI-generated content may contain errors. Please verify critical information