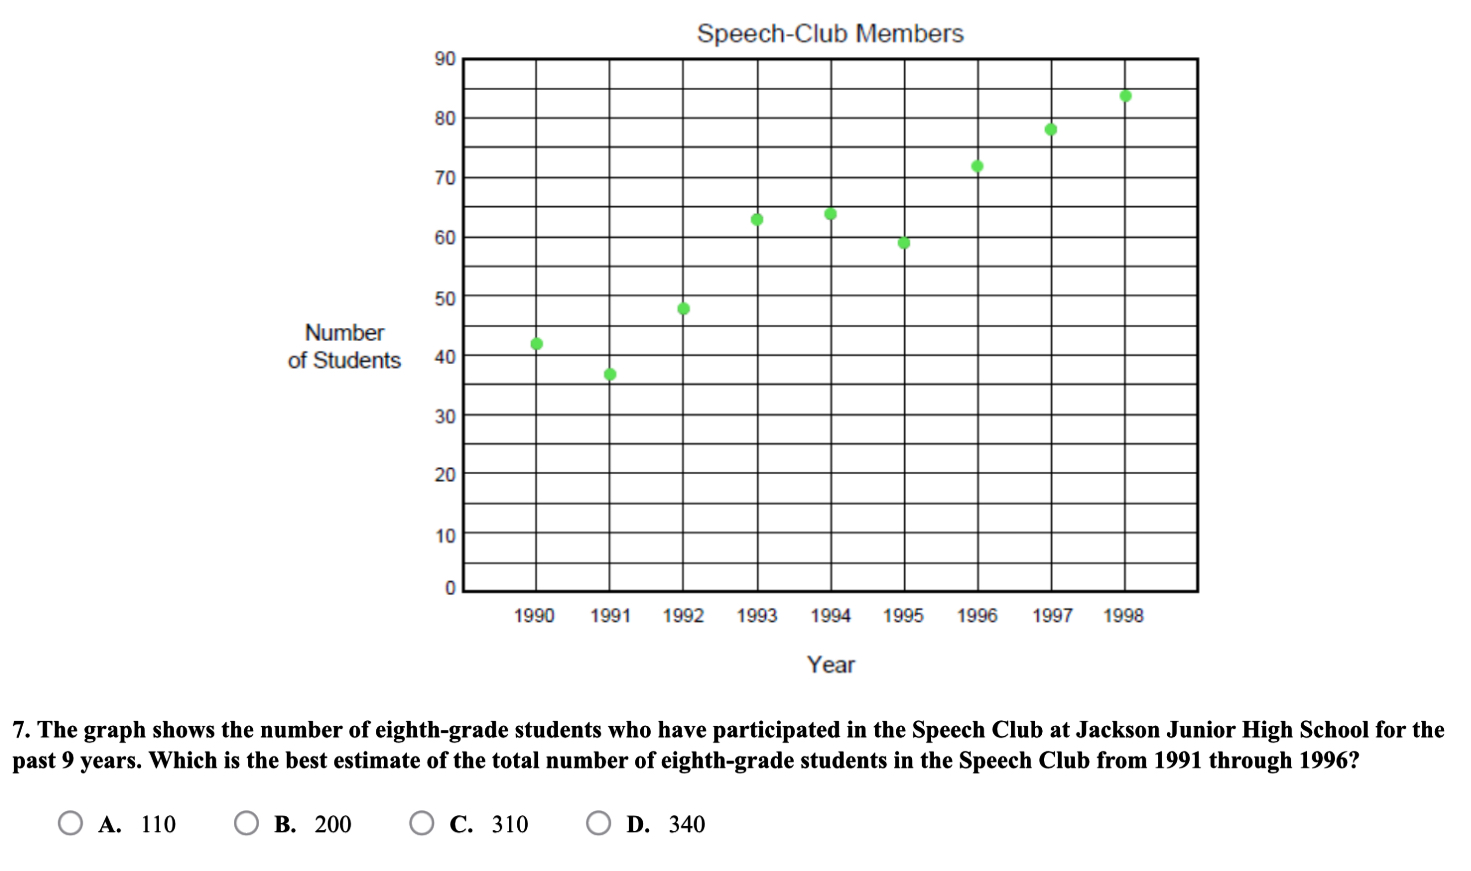
The graph shows the number of eighth-grade students who have participated in the Speech Club at Jackson Junior High School for the past 9 years. Which is the best estimate of the t... The graph shows the number of eighth-grade students who have participated in the Speech Club at Jackson Junior High School for the past 9 years. Which is the best estimate of the total number of eighth-grade students in the Speech Club from 1991 through 1996?

Understand the Problem
The question is asking to estimate the total number of eighth-grade students who participated in the Speech Club from 1991 to 1996, based on the provided graph.
Answer
The best estimate is $340$.
Answer for screen readers
The best estimate of the total number of eighth-grade students who participated in the Speech Club from 1991 through 1996 is approximately 340.
Steps to Solve
-
Identify the Years in Question We need to focus on the years from 1991 to 1996. This covers the years: 1991, 1992, 1993, 1994, 1995, and 1996.
-
Extract the Number of Students for Each Year From the graph, extract the number of students who participated in the Speech Club for each of the relevant years:
- 1991: Approximately 50 students
- 1992: Approximately 40 students
- 1993: Approximately 70 students
- 1994: Approximately 80 students
- 1995: Approximately 60 students
- 1996: Approximately 90 students
-
Calculate the Total Number of Students Add the estimated number of students for each of the years: [ 50 + 40 + 70 + 80 + 60 + 90 ]
-
Perform the Addition Calculate the sum step by step:
- First, add (50 + 40 = 90)
- Next, (90 + 70 = 160)
- Then, (160 + 80 = 240)
- Now, (240 + 60 = 300)
- Finally, (300 + 90 = 390)
-
Determine the Best Estimate From the sum of approximately 390, we need to choose the closest answer option provided:
- A. 110
- B. 200
- C. 310
- D. 340
The closest estimate is 340.
The best estimate of the total number of eighth-grade students who participated in the Speech Club from 1991 through 1996 is approximately 340.
More Information
The estimated total was derived from analyzing each year's participation recorded in the graph. Visual data representation helps in quickly understanding trends over time.
Tips
- Ignoring certain years in the calculation: Be diligent in noting all relevant years.
- Misreading the graph values: Ensure accurate readings from the graph for each year.
- Incorrect addition: Double-check calculations to avoid simple arithmetic errors.
AI-generated content may contain errors. Please verify critical information