The graph below has a ____ slope.

Understand the Problem
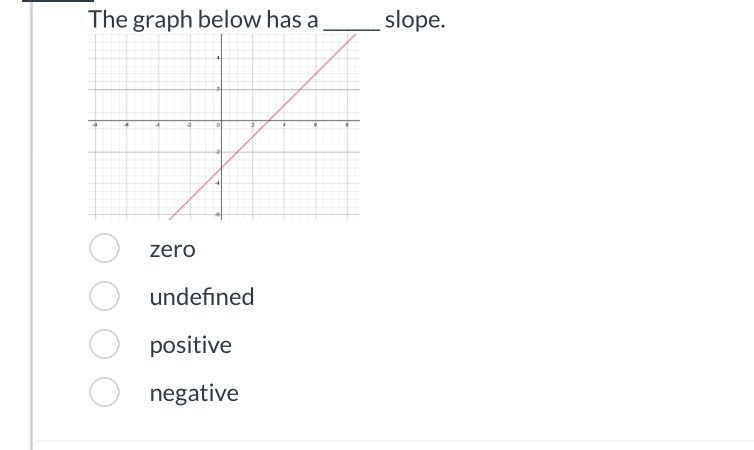
The question is asking about the slope of a line in a graph presented above. The options provided suggest the answer could be zero, undefined, positive, or negative. Since the graph shows a line, we are to determine the nature of its slope.
Answer
The graph below has a $ positive $ slope.
Answer for screen readers
The graph below has a positive slope.
Steps to Solve
- Identify the Graph Type
The graph shows a straight line, which indicates a linear function. This type of graph can have different slopes depending on its position.
- Observe the Direction of the Line
The line in the graph moves from the lower left quadrant to the upper right quadrant. This indicates that as $x$ increases, $y$ also increases.
- Determine the Slope
Since the line rises as it goes from left to right, we conclude that the slope is positive.
The graph below has a positive slope.
More Information
A positive slope means that for every unit increase in $x$, the value of $y$ increases as well. This is typical of most linear functions that trend upward on a graph.
Tips
null
AI-generated content may contain errors. Please verify critical information