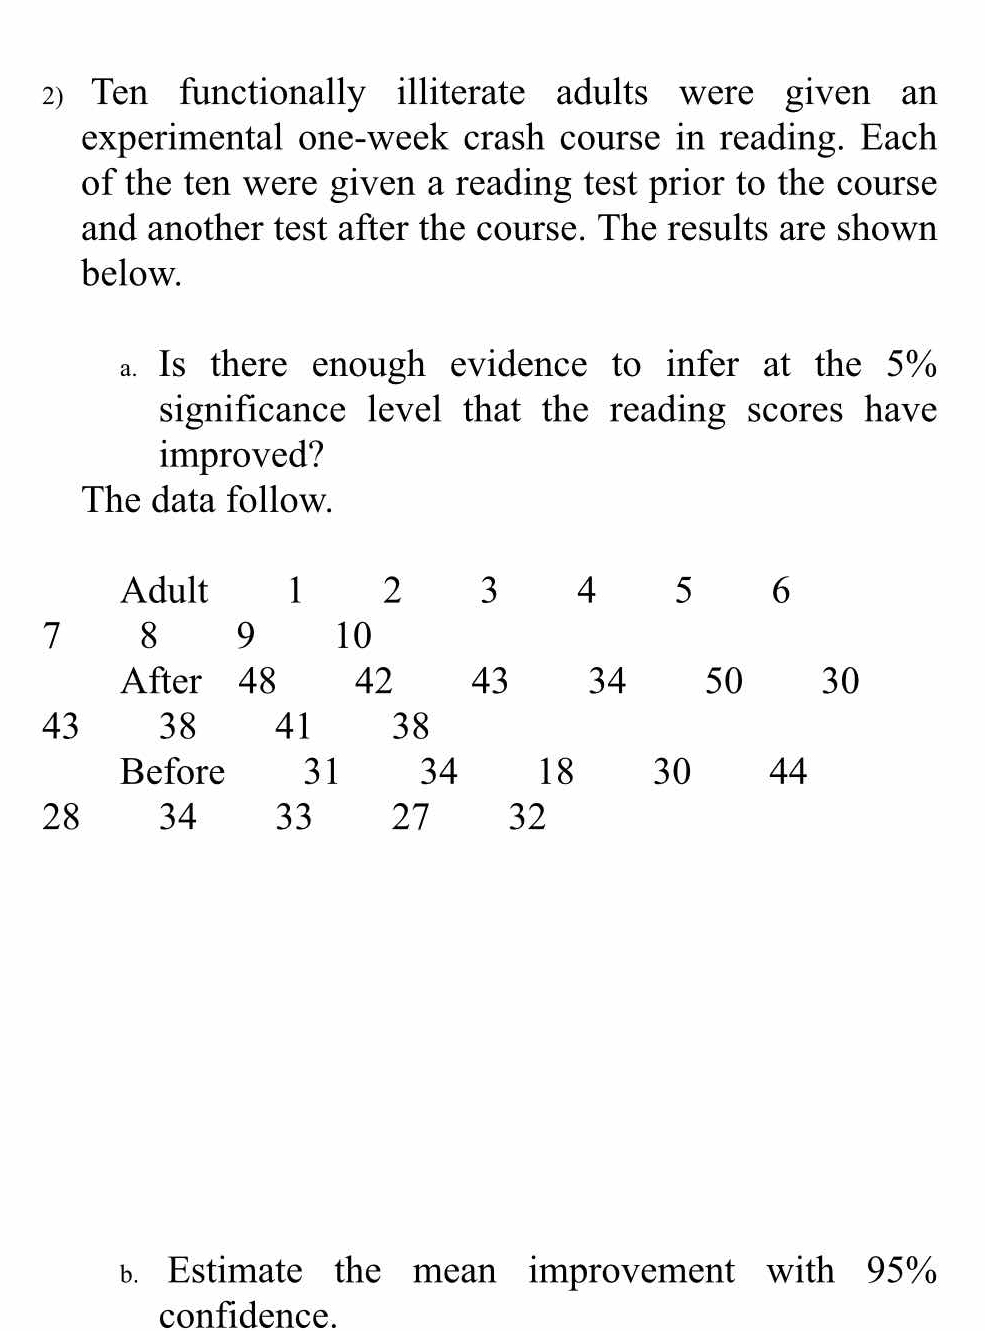
Ten functionally illiterate adults were given an experimental one-week crash course in reading. Each of the ten were given a reading test prior to the course and another test after... Ten functionally illiterate adults were given an experimental one-week crash course in reading. Each of the ten were given a reading test prior to the course and another test after the course. The results are shown below. a. Is there enough evidence to infer at the 5% significance level that the reading scores have improved? The data follow. Adult 1 2 3 4 5 6 7 8 9 10 After 48 42 43 34 50 30 43 38 41 38 Before 31 34 18 30 44 28 34 33 27 32 b. Estimate the mean improvement with 95% confidence.
Understand the Problem
The problem describes an experiment where ten adults were given a reading test before and after a one-week course. Part (a) asks to determine if there's enough evidence to conclude that the reading scores improved at a 5% significance level. Part (b) requires estimating the mean improvement with 95% confidence.
Answer
(a) Yes. (b) $(4.54, 14.66)$
Answer for screen readers
(a) Yes, there is enough evidence to infer at the 5% significance level that the reading scores have improved.
(b) The 95% confidence interval for the mean improvement is $(4.54, 14.66)$.
Steps to Solve
Here's how to solve this problem, step-by-step:
(a) Hypothesis Testing
- Calculate the differences: Subtract the "Before" score from the "After" score for each adult. These differences will be used for the hypothesis test. $d_i = \text{After}_i - \text{Before}_i$ for $i = 1, 2, ..., 10$
$d_1 = 48 - 31 = 17$ $d_2 = 42 - 34 = 8$ $d_3 = 43 - 18 = 25$ $d_4 = 34 - 30 = 4$ $d_5 = 50 - 44 = 6$ $d_6 = 30 - 28 = 2$ $d_7 = 43 - 34 = 9$ $d_8 = 38 - 33 = 5$ $d_9 = 41 - 27 = 14$ $d_{10} = 38 - 32 = 6$
-
State the null and alternative hypotheses: $H_0: \mu_d = 0$ (There is no improvement in reading scores) $H_1: \mu_d > 0$ (Reading scores have improved) Where $\mu_d$ is the mean difference.
-
Calculate the sample mean difference ($\bar{d}$): $\bar{d} = \frac{\sum_{i=1}^{10} d_i}{n} = \frac{17 + 8 + 25 + 4 + 6 + 2 + 9 + 5 + 14 + 6}{10} = \frac{96}{10} = 9.6$
-
Calculate the sample standard deviation of the differences ($s_d$): $s_d = \sqrt{\frac{\sum_{i=1}^{10} (d_i - \bar{d})^2}{n-1}}$
First, calculate the squared differences $(d_i - \bar{d})^2$: $(17-9.6)^2 = 7.4^2 = 54.76$ $(8-9.6)^2 = -1.6^2 = 2.56$ $(25-9.6)^2 = 15.4^2 = 237.16$ $(4-9.6)^2 = -5.6^2 = 31.36$ $(6-9.6)^2 = -3.6^2 = 12.96$ $(2-9.6)^2 = -7.6^2 = 57.76$ $(9-9.6)^2 = -0.6^2 = 0.36$ $(5-9.6)^2 = -4.6^2 = 21.16$ $(14-9.6)^2 = 4.4^2 = 19.36$ $(6-9.6)^2 = -3.6^2 = 12.96$
Sum of squared differences $= 54.76 + 2.56 + 237.16 + 31.36 + 12.96 + 57.76 + 0.36 + 21.16 + 19.36 + 12.96 = 450.4$
$s_d = \sqrt{\frac{450.4}{10-1}} = \sqrt{\frac{450.4}{9}} = \sqrt{50.0444} \approx 7.074$
-
Calculate the t-statistic: $t = \frac{\bar{d} - 0}{s_d / \sqrt{n}} = \frac{9.6}{7.074 / \sqrt{10}} = \frac{9.6}{7.074 / 3.162} = \frac{9.6}{2.237} \approx 4.291$
-
Determine the critical t-value: Degrees of freedom = $n - 1 = 10 - 1 = 9$ Significance level, $\alpha = 0.05$ Using a t-table or calculator, the critical t-value for a one-tailed test with 9 degrees of freedom and $\alpha = 0.05$ is $t_{crit} = 1.833$
-
Make a decision: Since the calculated t-statistic ($4.291$) is greater than the critical t-value ($1.833$), we reject the null hypothesis.
-
Conclusion: There is enough evidence to infer at the 5% significance level that the reading scores have improved.
(b) Confidence Interval
-
Calculate the margin of error: Margin of error $= t_{\alpha/2, n-1} \times \frac{s_d}{\sqrt{n}}$ For a 95% confidence interval, $\alpha = 1 - 0.95 = 0.05$, and $\alpha/2 = 0.025$. From the t-table, $t_{0.025, 9} = 2.262$. Margin of error $= 2.262 \times \frac{7.074}{\sqrt{10}} = 2.262 \times 2.237 \approx 5.06$
-
Calculate the confidence interval: Confidence interval $= \bar{d} \pm \text{Margin of error} = 9.6 \pm 5.06$ Lower bound $= 9.6 - 5.06 = 4.54$ Upper bound $= 9.6 + 5.06 = 14.66$
-
Conclusion: We are 95% confident that the mean improvement in reading scores is between 4.54 and 14.66.
(a) Yes, there is enough evidence to infer at the 5% significance level that the reading scores have improved.
(b) The 95% confidence interval for the mean improvement is $(4.54, 14.66)$.
More Information
The t-test is appropriate here because we are dealing with a small sample size ($n < 30$) and the population standard deviation is unknown. The confidence interval provides a range within which the true mean improvement likely lies, given our sample data.
Tips
- Using the wrong t-value: It's crucial to use the correct t-value based on the degrees of freedom ($n-1$) and the significance level ($\alpha$ for hypothesis testing, $\alpha/2$ for confidence intervals).
- Incorrectly calculating differences: Ensure you subtract consistently (After - Before). Switching the order will lead to incorrect results.
- Confusing hypothesis test with confidence interval: These are two different procedures with different goals. A hypothesis test aims to reject or fail to reject a specific null hypothesis, while a confidence interval estimates a range for a population parameter.
- Using a z-test instead of a t-test: Since the population standard deviation is unknown and the sample size is small ($n<30$), we should use a t-test instead of a z-test.
- Misinterpreting the results of the hypothesis test: Failing to reject the null hypothesis does not mean the null hypothesis is true, only that there is not enough evidence to reject it.
- Incorrectly calculating the standard deviation: Errors in this calculation will propagate through the rest of the problem.
AI-generated content may contain errors. Please verify critical information