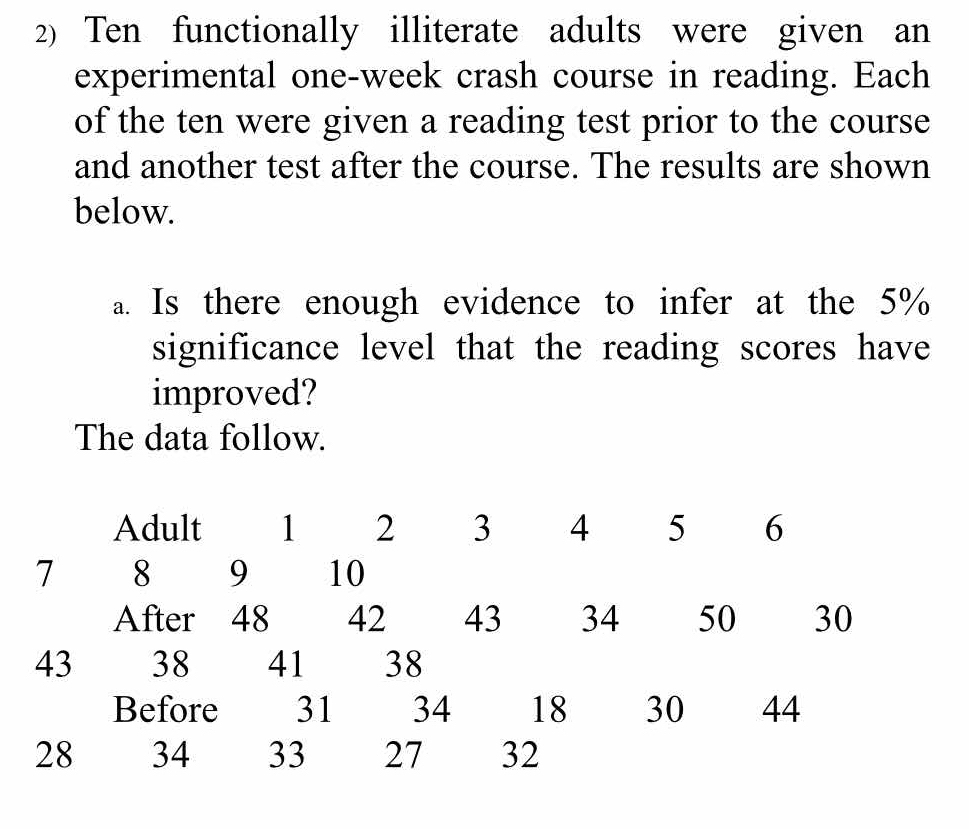
Ten functionally illiterate adults were given an experimental one-week crash course in reading. Each of the ten were given a reading test prior to the course and another test after... Ten functionally illiterate adults were given an experimental one-week crash course in reading. Each of the ten were given a reading test prior to the course and another test after the course. Given the results below, is there enough evidence to infer at the 5% significance level that the reading scores have improved? Adult: 1 2 3 4 5 6 7 8 9 10 After: 48 42 43 34 50 30 43 38 41 38 Before: 31 34 18 30 44 28 34 33 27 32
Understand the Problem
The question describes an experiment where ten adults were given a one-week reading course. Their reading scores were measured before and after the course. We need to determine if there is enough statistical evidence to conclude that their reading scores improved after the course at a 5% significance level, given the data provided.
Answer
Yes, there is sufficient evidence to conclude that the reading scores improved at a 5% significance level. The t-statistic ($t \approx 4.291$) exceeds the critical value ($t_{0.05, 9} \approx 1.833$), leading to rejection of the null hypothesis.
Answer for screen readers
Yes, there is enough evidence to infer at the 5% significance level that the reading scores have improved. The calculated t-statistic ($t \approx 4.291$) is greater than the critical value ($t_{0.05, 9} \approx 1.833$), leading us to reject the null hypothesis.
Steps to Solve
- Calculate the difference for each adult
First, we need to calculate the difference between the 'After' score and the 'Before' score for each adult. This will tell us how much each individual improved.
$d_i =$ After Score$_i$ - Before Score$_i$
So we have: $d_1 = 48 - 31 = 17$ $d_2 = 42 - 34 = 8$ $d_3 = 43 - 18 = 25$ $d_4 = 34 - 30 = 4$ $d_5 = 50 - 44 = 6$ $d_6 = 30 - 28 = 2$ $d_7 = 43 - 34 = 9$ $d_8 = 38 - 33 = 5$ $d_9 = 41 - 27 = 14$ $d_{10} = 38 - 32 = 6$
- Calculate the mean difference ($\bar{d}$)
Next, calculate the mean of these differences.
$$ \bar{d} = \frac{\sum_{i=1}^{n} d_i}{n} $$
where $n$ is the number of adults (10 in this case).
$$ \bar{d} = \frac{17 + 8 + 25 + 4 + 6 + 2 + 9 + 5 + 14 + 6}{10} = \frac{96}{10} = 9.6 $$
- Calculate the standard deviation of the differences ($s_d$)
Now, we need to calculate the standard deviation of the differences.
$$ s_d = \sqrt{\frac{\sum_{i=1}^{n} (d_i - \bar{d})^2}{n-1}} $$
First, find the squared differences $(d_i - \bar{d})^2$: $(17 - 9.6)^2 = 7.4^2 = 54.76$ $(8 - 9.6)^2 = -1.6^2 = 2.56$ $(25 - 9.6)^2 = 15.4^2 = 237.16$ $(4 - 9.6)^2 = -5.6^2 = 31.36$ $(6 - 9.6)^2 = -3.6^2 = 12.96$ $(2 - 9.6)^2 = -7.6^2 = 57.76$ $(9 - 9.6)^2 = -0.6^2 = 0.36$ $(5 - 9.6)^2 = -4.6^2 = 21.16$ $(14 - 9.6)^2 = 4.4^2 = 19.36$ $(6 - 9.6)^2 = -3.6^2 = 12.96$
Sum of squared differences = $54.76 + 2.56 + 237.16 + 31.36 + 12.96 + 57.76 + 0.36 + 21.16 + 19.36 + 12.96 = 450.4$
$$ s_d = \sqrt{\frac{450.4}{10-1}} = \sqrt{\frac{450.4}{9}} = \sqrt{50.0444} \approx 7.074 $$
- State the null and alternative hypotheses
- Null Hypothesis ($H_0$): The reading scores have not improved ($\mu_d = 0$).
- Alternative Hypothesis ($H_1$): The reading scores have improved ($\mu_d > 0$). This is a one-tailed test.
- Calculate the t-statistic
We use a t-test for paired data because we are comparing the 'before' and 'after' scores for the same individuals.
$$ t = \frac{\bar{d} - \mu_d}{\frac{s_d}{\sqrt{n}}} $$
where $\mu_d$ is the hypothesized mean difference under the null hypothesis (which is 0).
$$ t = \frac{9.6 - 0}{\frac{7.074}{\sqrt{10}}} = \frac{9.6}{\frac{7.074}{3.162}} = \frac{9.6}{2.237} \approx 4.291 $$
- Determine the critical value
Since we have a one-tailed test at a 5% significance level with $n-1 = 10-1 = 9$ degrees of freedom, we look up the t-critical value in a t-distribution table. The critical value is approximately 1.833.
- Make a decision
Compare the calculated t-statistic with the critical value. If the t-statistic is greater than the critical value, we reject the null hypothesis.
Since $4.291 > 1.833$, we reject the null hypothesis.
- Conclusion
There is enough evidence at the 5% significance level to conclude that the reading scores have improved after the one-week crash course.
Yes, there is enough evidence to infer at the 5% significance level that the reading scores have improved. The calculated t-statistic ($t \approx 4.291$) is greater than the critical value ($t_{0.05, 9} \approx 1.833$), leading us to reject the null hypothesis.
More Information
This is a paired t-test, which is used when you have two sets of observations on the same individuals or items, and you want to see if there is a significant difference between the means of the two sets.
Tips
A common mistake is to use an independent samples t-test instead of a paired t-test. The key is to recognize that the data points are related (before and after scores for the same person). Also, errors in calculating the differences, mean, standard deviation, or incorrectly using the t-table can lead to wrong conclusions. Forgetting to use n-1 degrees of freedom when looking up values in the t-table is another common mistake.
AI-generated content may contain errors. Please verify critical information