Several statistics questions are provided in the attached image.
Understand the Problem
The image contains several statistics questions, I will classify each question separately.
- Assertion and Reason question: Determine the truthfulness of the assertion: "Simple bar diagrams represent only one variable" and the reason: "Simple bar diagrams bear uniform thickness".
- Assertion and Reason question: Determine the truthfulness of the assertion: "It will be of low degree of positive correlation o and + 0.25" and the reason: "It will be low degree of negative correlation o and -0.25".
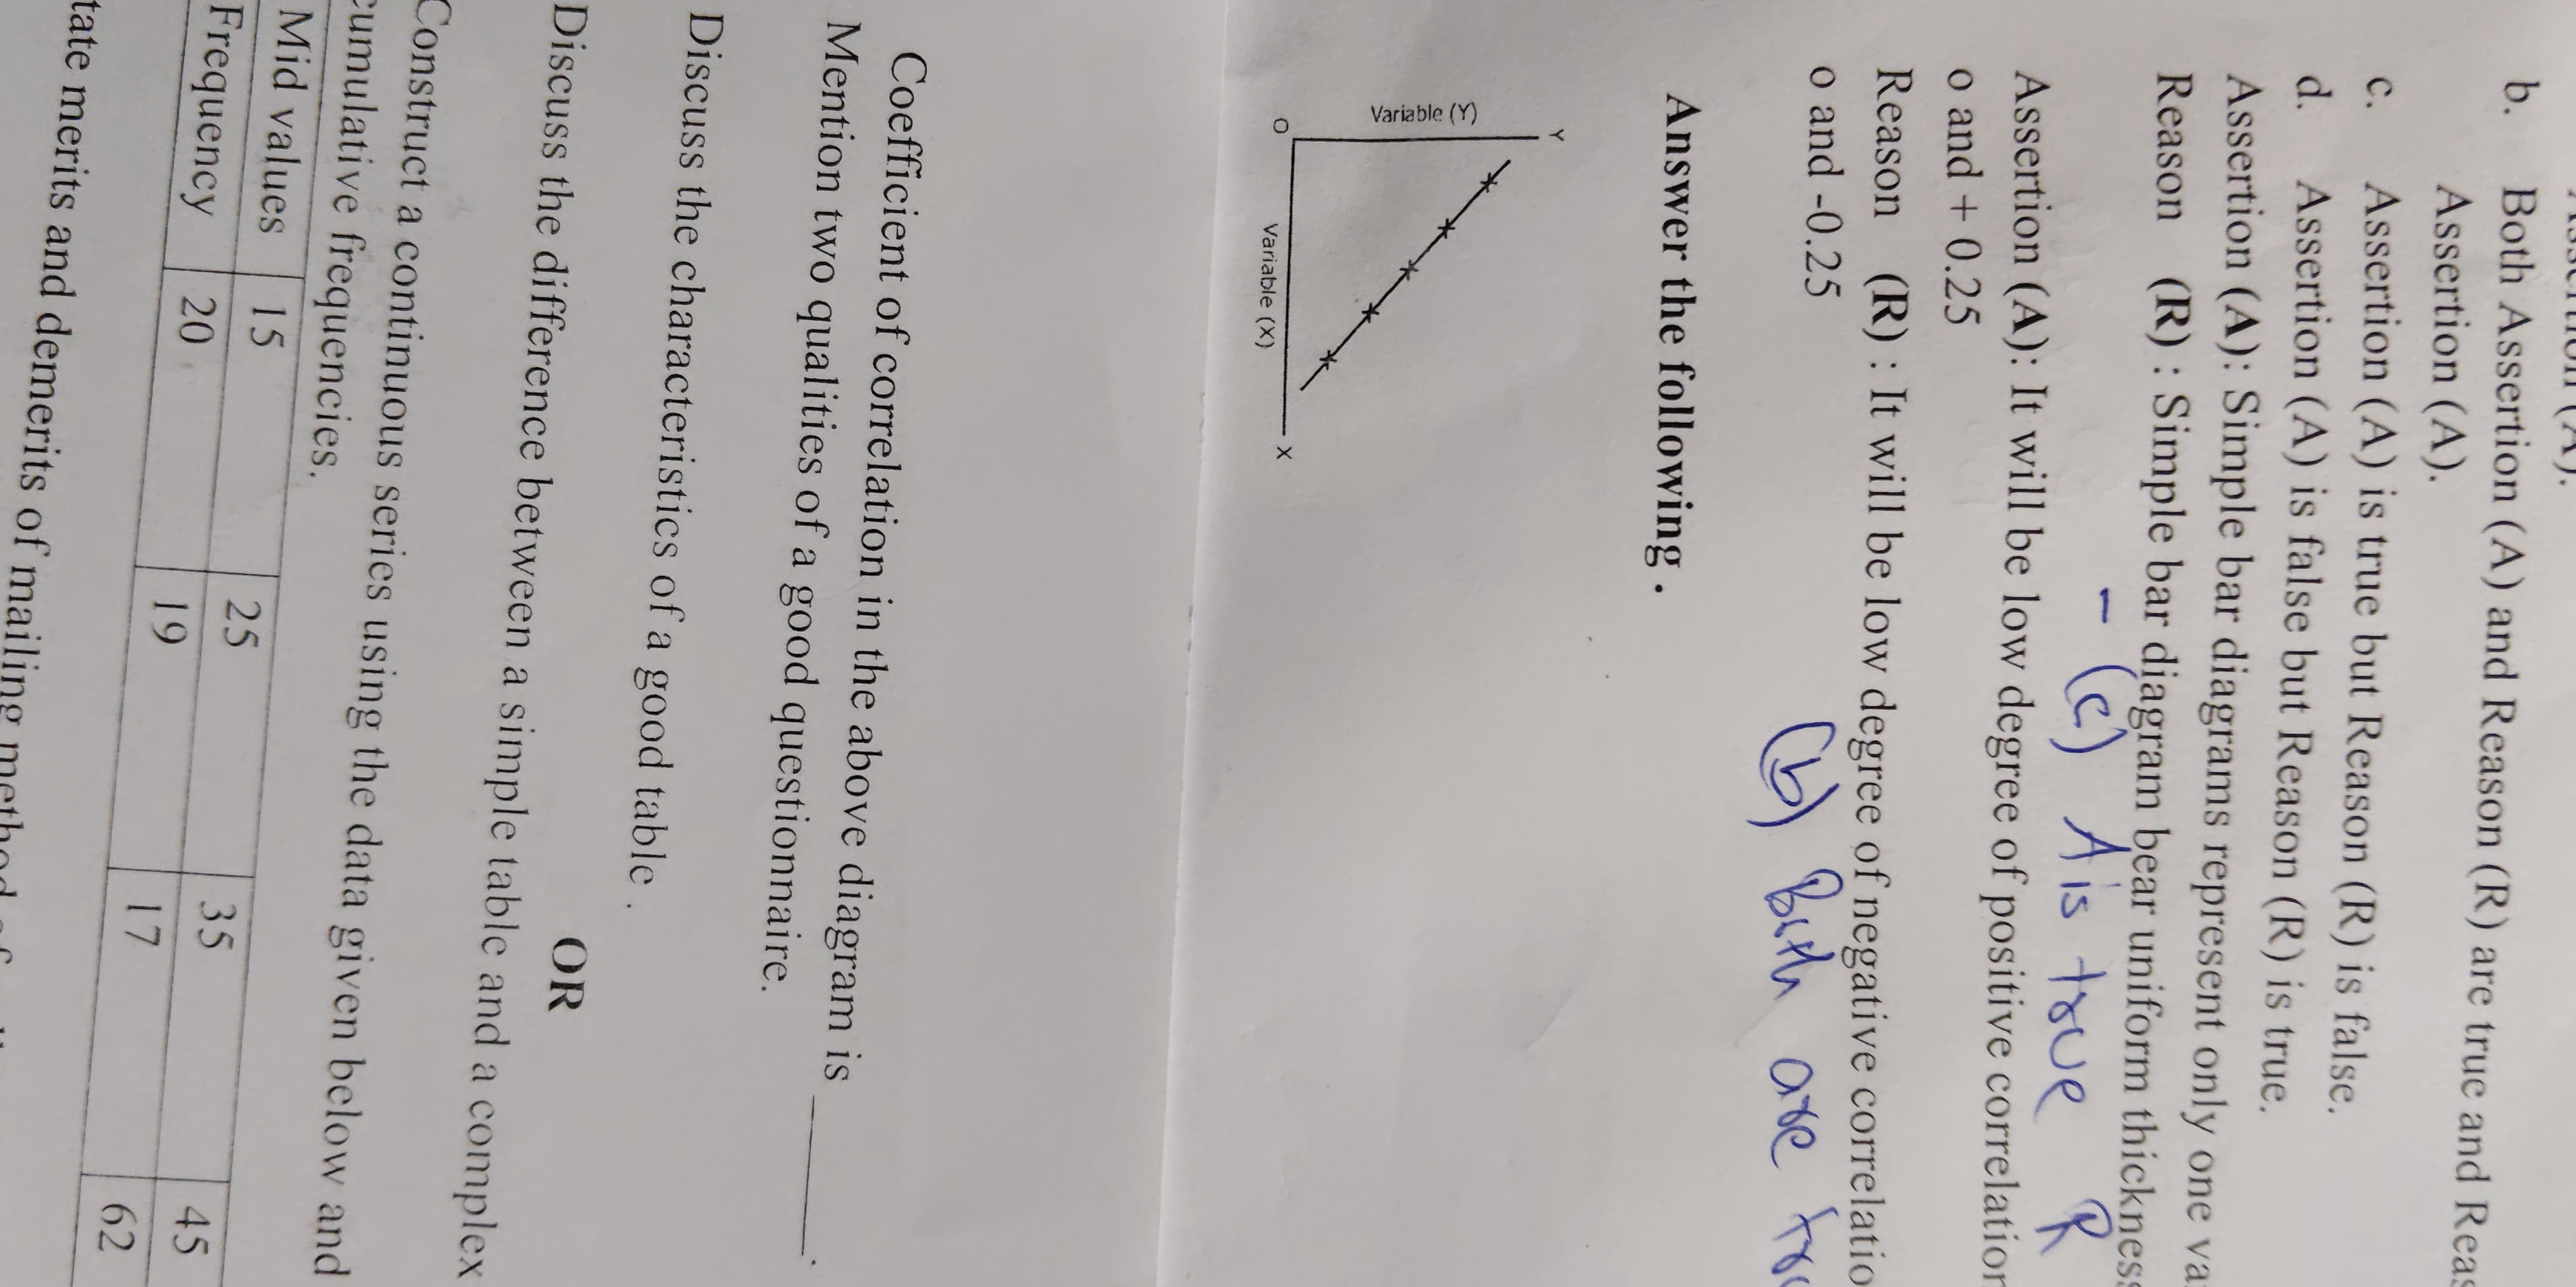
- Determine the coefficient of correlation in the provided diagram.
- Mention two qualities of a good questionnaire.
- Discuss the characteristics of a good table.
- Discuss the difference between a simple table and a complex table.
- Construct a continuous series using the data given below and cumulative frequencies.
Answer
* Assertion (A) is true but Reason (R) is false. * Both are true. * High degree of positive correlation. * Clear and concise questions & logical flow. * Cannot be answered without class interval.
Here are the answers to the questions:
- Assertion (A) and Reason (R): Assertion (A) is true but Reason (R) is false.
- Assertion (A) and Reason (R): Both are true.
- Coefficient of correlation in the above diagram: High degree of positive correlation.
- Two qualities of a good questionnaire: Clear and concise questions & logical flow.
- Construct a continuous series using the data given below and cumulative frequencies: This question cannot be answered without further information such as class interval.
Answer for screen readers
Here are the answers to the questions:
- Assertion (A) and Reason (R): Assertion (A) is true but Reason (R) is false.
- Assertion (A) and Reason (R): Both are true.
- Coefficient of correlation in the above diagram: High degree of positive correlation.
- Two qualities of a good questionnaire: Clear and concise questions & logical flow.
- Construct a continuous series using the data given below and cumulative frequencies: This question cannot be answered without further information such as class interval.
More Information
The coefficient of correlation ranges from -1 to +1, where values close to +1 indicate a strong positive correlation.
Tips
Pay attention to whether it's a negative or positive correlation
AI-generated content may contain errors. Please verify critical information
Thank you for voting!