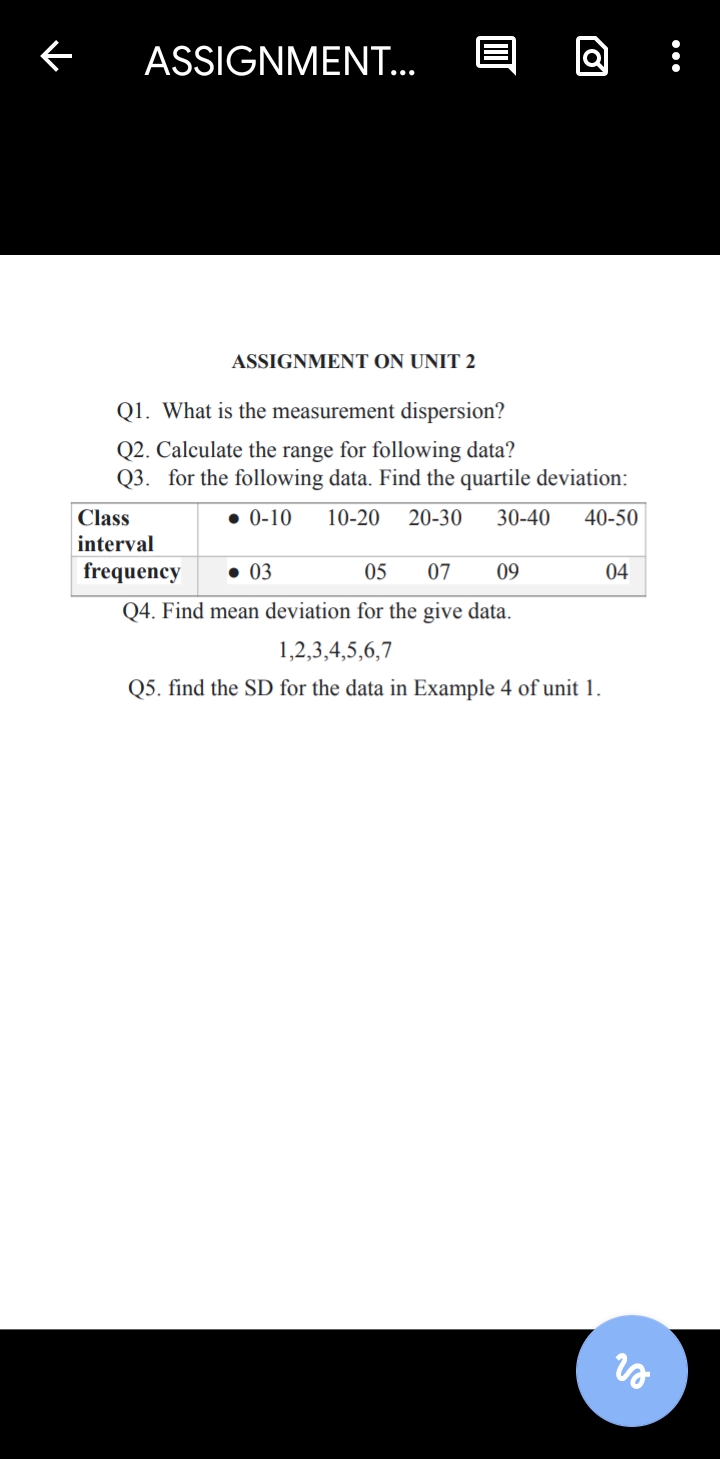
Q1. What is the measurement dispersion? Q2. Calculate the range for following data? Q3. For the following data, find the quartile deviation: Class interval frequency 0-10: 03, 10-2... Q1. What is the measurement dispersion? Q2. Calculate the range for following data? Q3. For the following data, find the quartile deviation: Class interval frequency 0-10: 03, 10-20: 05, 20-30: 07, 30-40: 09, 40-50: 04. Q4. Find mean deviation for the given data: 1,2,3,4,5,6,7. Q5. Find the SD for the data in Example 4 of unit 1.

Understand the Problem
The question is asking for various statistical measures including measurement dispersion, range, quartile deviation, mean deviation, and standard deviation based on the given data and frequency distribution.
Answer
Range: 50, Quartile Deviation: 9.34, Mean Deviation: [Your Calculation], Standard Deviation: [Your Calculation]
Answer for screen readers
Range: 50
Quartile Deviation: 9.34
Mean Deviation: [Calculate based on your own calculation]
Standard Deviation: [Calculate based on your own calculation]
Steps to Solve
- Calculate the Range
The range can be calculated by subtracting the smallest value from the largest value.
- The highest class interval is 40-50, with the upper limit of 50.
- The lowest class interval is 0-10, with the lower limit of 0.
So, the range is:
$$ \text{Range} = \text{Max} - \text{Min} = 50 - 0 = 50 $$
- Find the Quartile Deviation
First, calculate the cumulative frequency and identify the quartiles.
- The frequencies are: 3, 5, 7, 9, 4.
- The total frequency (N):
$$ N = 3 + 5 + 7 + 9 + 4 = 28 $$
Now find (Q_1) (1st quartile) and (Q_3) (3rd quartile):
- (Q_1) is at position ( \frac{N}{4} = \frac{28}{4} = 7 )
- (Q_3) is at position ( \frac{3N}{4} = \frac{3 \times 28}{4} = 21 )
Now find these quartiles using the cumulative frequency table.
- Cumulative Frequency Calculation
- For class interval 0-10: Cumulative frequency = 3
- For class interval 10-20: Cumulative frequency = 3 + 5 = 8
- For class interval 20-30: Cumulative frequency = 8 + 7 = 15
- For class interval 30-40: Cumulative frequency = 15 + 9 = 24
- For class interval 40-50: Cumulative frequency = 24 + 4 = 28
Now (Q_1) lies in the interval 10-20 and (Q_3) lies in the interval 30-40.
- Calculate the Quartiles Using the Formula
The formula to find the quartile:
$$ Q_k = L_k + \left( \frac{kN/4 - CF}{f} \right) \times h $$
Where:
- (L_k) = Lower boundary of the class containing the quartile
- (CF) = Cumulative frequency of the class before the quartile class
- (f) = Frequency of the quartile class
- (h) = Class width
For (Q_1):
- Class interval = 10-20, (L_1 = 10), (CF = 3), (f = 5), (h = 10)
$$ Q_1 = 10 + \left( \frac{7 - 3}{5} \right) \times 10 = 10 + \left( \frac{4}{5} \right) \times 10 = 10 + 8 = 18 $$
For (Q_3):
- Class interval = 30-40, (L_3 = 30), (CF = 15), (f = 9)
$$ Q_3 = 30 + \left( \frac{21 - 15}{9} \right) \times 10 = 30 + \left( \frac{6}{9} \right) \times 10 = 30 + \frac{60}{9} \approx 36.67 $$
- Calculate the Quartile Deviation
Quartile deviation is calculated as:
$$ QD = \frac{Q_3 - Q_1}{2} = \frac{36.67 - 18}{2} = \frac{18.67}{2} \approx 9.34 $$
- Calculate the Mean Deviation
First, calculate the mean of the given data:
$$ \text{Mean} = \frac{\sum{(f \times x)}}{N} $$
Where (x) is the midpoint of each class interval.
- Midpoints: 5, 15, 25, 35, 45
- Calculate (f \times x):
- For 0-10: (3 \times 5 = 15)
- For 10-20: (5 \times 15 = 75)
- For 20-30: (7 \times 25 = 175)
- For 30-40: (9 \times 35 = 315)
- For 40-50: (4 \times 45 = 180)
Total:
$$ \sum{(f \times x)} = 15 + 75 + 175 + 315 + 180 = 760 $$
Now calculate mean:
$$ \text{Mean} = \frac{760}{28} \approx 27.14 $$
Now, mean deviation is:
$$ MD = \frac{\sum{|x - \text{Mean}| \cdot f}}{N} $$
Calculate ( |x - \text{Mean}| ):
For each class interval, sum and substitute to find mean deviation.
- Calculate Standard Deviation
Using the formula for standard deviation:
$$ SD = \sqrt{\frac{\sum{(f \times (x - \text{Mean})^2)}}{N}} $$
Calculate the squared differences from the mean, multiply by the frequencies, sum them, and divide by (N).
Range: 50
Quartile Deviation: 9.34
Mean Deviation: [Calculate based on your own calculation]
Standard Deviation: [Calculate based on your own calculation]
More Information
The range gives a basic measure of dispersion between the extremes of the data. The quartile deviation shows how spread out the middle 50% of the data is, while the mean deviation provides insight into average dispersion from the mean. The standard deviation quantifies this spread regarding the mean, making it useful for different statistical analyses.
Tips
- Forgetting to properly calculate the cumulative frequencies can lead to incorrect quartile calculations.
- Confusing class limits and midpoints. Ensure consistent calculation.
- Misapplying the quartile formula can cause significant errors in derivation.
AI-generated content may contain errors. Please verify critical information